# db_m is the connection to the database as in Section 1.2
subcs <- DBI::dbGetQuery(db_m,
          "SELECT site, nextds, nus, agg_order, scarea FROM subcs;")
DBI::dbDisconnect(db_m)
subcs <- subcs[order(subcs$nus, subcs$agg_order),]
subcs$carea_km2 <- NA
# All subcatchments of agg_order 1 have no subcatchments upstream. Their
# catchment area (in km2) = their subcatchment area (in m2 * 1e-6)
subcs$carea_km2[subcs$agg_order == 1] <-
  subcs$scarea[subcs$agg_order == 1] * 1e-6
  for(i in min(which(subcs$agg_order == 2)):nrow(subcs)){
# Loop through all remaining subcatchments, adding its subcatchment area to the
# (already calculated) catchment areas of subcatchments immediately upstream
    if(sum(is.na(subcs$carea_km2[subcs$nextds == subcs$site[i]])) > 0) stop("1")
    subcs$carea_km2[i] <-
      sum(subcs$carea_km2[subcs$nextds == subcs$site[i]],
          subcs$scarea[i] * 1e-6)
    if(i %% 10000 == 0) cat(i,"\n")
}4 Using the database tables for mapping and analysis
4.1 Snapping monitoring sites to stream lines
If you have site locations that you need to match to the stream network, you can upload point geographic data (with either decimal latitude and longitude, or Map Grid of Australia GDA 1994, Zone 55 coordinates) to the mwstr_sitecode_generator app. The app snaps the points to the nearest stream (with greater confidence if strcode or stream names are included in the data, as the app will snap to the nearest stream line matching the supplied strcode or stream name), and returns an excel file and a geopackage (gpkg) file with the moved (if necessary) points and their reach codes.
The mwstr_sitecode_generator app uses the function snap_site_to_reach() ( in mwstr_network_functions.R). The function takes a single simple features (sf) point object in R and snaps it to the nearest stream line, using strcode or stream_name, if supplied. However, the function requires read-write access to the mwstr database, so to use this function you either need access to the unimelb database or build your own database (see Appendix C)
4.2 Calculating catchment statistics
Several of the tables described in earlier chapters contain information that allow rapid calculation of catchment statistics.
The network relationships implicit in the site and nextds fields in the subcs table allow rapid network calculations when converted to an igraph object (C and Nepusz 2006), which is the method used by the
all_us()andall_ds()functions for retrieving all upstream and downstream reaches/subcatchments1.The full catchment boundaries in the cats table were precompiled using upstream aggregation, and are used by the stream explorer app to display catchment boundaries.
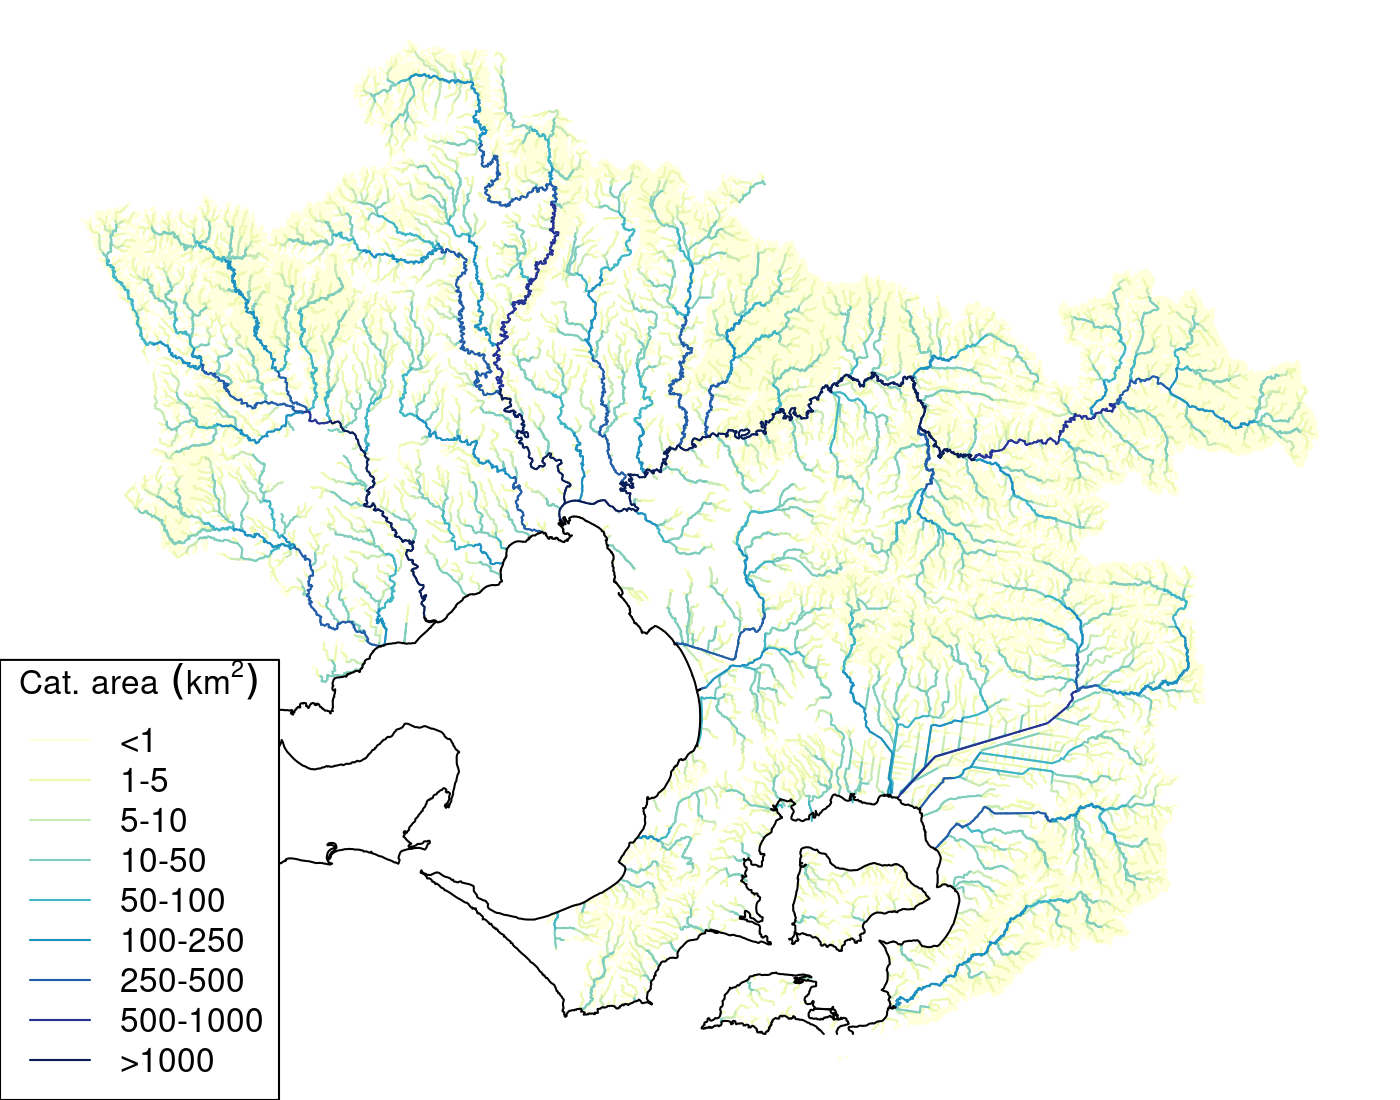
The nus (number of subcatchments/reaches upstream) and agg_order (optimal order for calculating network statistics) in the subcs table are valuable for rapidly calculating statistics on all reaches of the network. If the dataset is ordered by nus and then by agg_order, looping through all subcatchments aggregating a statistic for each subcatchment with the full-catchment statistics of the subcatchment(s) immediately upstream allows rapid calculation of catchment statistics. This approach is usually faster than using the
all_us()function for summing upstream subcatchment statistics. For instance, calculating all catchment areas usingall_us()typically takes ~6 min, while using the agg_order method of adding subcatchment area to the already calculated subcatchment areas of immediately upstream catchment(s) takes ~1.5 min. The following code chunk reproduces the agg_order method of calculating catchment areas and Table 3.1 plots the result mapped to the streams layer.
4.3 Using catchment area to derive reachcodes
The catchment area values were used to derive unique, meaningful reach codes for every reach. The reach codes consist of the three-character strcode (see section 3.5 Table stream_names) and a variable-length integer suffix equal to the catchment size of the reach in ha. To avoid any potential confusion with 7-character sitecodes used in earlier datasets (which used, in many cases, the same stream codes, but a different catchment area convention), the strcode and suffix are separated by an underscore in version 1.2/1.3 reachcodes (to distinguish them from the version 1.1 codes separated by hyphens).
Thus, for instance, the reach of the Yarra River at Whittons Reserve, Wonga Park (YAR_223486) has a catchment area of 2,235 km2, Little Stringybark Creek at the gauge in Wandin North (LIS_453) has a catchment area of 4.5 km2, and a spring in the headwaters of Ythan Creek near Mt Donna Buang (9YF_7, on TRIB (9YF) OF TRIB (9YE) OF TRIB (9YB) OF TRIB (LQD) OF YTHAN CREEK
) has a catchment area of 7 ha.
4.4 Mapping streams and catchments using stream names or site codes
Stream names can be used to plot (and save) the lines of a stream, and optionally its tributaries and catchment boundary. For instance, the following code (plot_allus() functions from mwstr_network_functions.R (see the mwstr downloads page) produced the four plots of the moderately large catchment of Deep Creek (Trib of Maribyrnong) shown in Figure 4.2.
# db_m is the connection to the database.
# mwstr_dir is the path containing the database rasters.  See Section 1.2
strcodei <- "DPW"
site <- DBI::dbGetQuery(db_m, paste0("SELECT termreach FROM stream_names ",
                              "WHERE strcode = '", strcodei, "';"))$termreach
par(mar = c(0,0,0,0), mfrow = c(1,4))
  plot_allus(site, plot_tribs = FALSE, plot_catchment = FALSE,
             add_title = FALSE, mwstr_connection = db_m)
  title(main = " A.", adj = 0, line = -1)
  plot_allus(site, plot_tribs = TRUE, plot_catchment = FALSE,
             add_title = FALSE, mwstr_connection = db_m)
  title(main = " B.", adj = 0, line = -1)
  plot_allus(site, plot_tribs = TRUE, plot_catchment = TRUE,
             add_title = FALSE, mwstr_connection = db_m)
  title(main = " C.", adj = 0, line = -1)
  plot_allus(site, plot_tribs = TRUE, sampleable_only = TRUE,
             add_title = FALSE, plot_catchment = TRUE, mwstr_connection = db_m)
  title(main = " D.", adj = 0, line = -1)
The plot_allus() function also permits using raster tables in the database as basemaps to stream and catchment plots (e.g. Figure 4.3)
# Extract all sites upstream of 360925 (Wattle Valley Ck in Mt Evelyn)
lsn <- all_us(360925, mwstr_connection = db_m)
lsn_str <- paste(lsn,collapse = ",")
lsn_pps <- sf::st_read(db_m, query =
            paste0("SELECT * FROM subc_pps WHERE site in (",lsn_str,");"))

par(mfrow = c(2,2),mar = c(0,0,0,0))
plot_allus(360925, basemap = r_site, mwstr_connection = db_m, add_title = FALSE)
# Add pourpoints to plot
plot(lsn_pps$geom, add = TRUE, pch = 21, bg = "white")
title(main = "A.", adj = 0, line = -1)
plot_allus(360925, basemap = r_dem, mwstr_connection = db_m, add_title = FALSE)
title(main = "B.", adj = 0, line = -1)
plot_allus(360925, basemap = r_hillshade, mwstr_connection = db_m, add_title = FALSE)
title(main = "C.", adj = 0, line = -1)
plot_allus(360925, basemap = r_d2str, mwstr_connection = db_m, add_title = FALSE)
title(main = "D.", adj = 0, line = -1)
The stream explorer app provides a web-based means of deriving such subsets of the data, allowing download of the derived catchment boundaries as GIS files. Stream names, strcodes, reach codes, and site codes can be explored interactively using the selection menu on the app.
See the example code in the technical tips page of the stream network website for an example of the direct use of igraph functions for such calculations.↩︎