Appendix D — Using the stream explorer app
The Melbourne Stream Network Stream Explorer
App is an interface for exploring the Melbourne Stream Network dataset. It allows you to find reaches of interest and to download their catchment boundaries as a GIS file (.gpkg) and all environmental attributes for those reaches from the tables subc_env and cat_env.
D.1 Select by stream name or code
Clicking on the selector box reveals the full list of streams1. Either select from the drop-down list, or press delete and start typing. The drop-down list selection will narrow to match the text you enter, either by name or by stream code. The default is Gardiners Creek, which has strcode GRD. The examples below provide guidance on finding a stream if you are unsure of its name or code.

Every stream in the network has a unique name, and a unique three-letter stream code (strcode in tables streams and subcs: see Section 3.5).
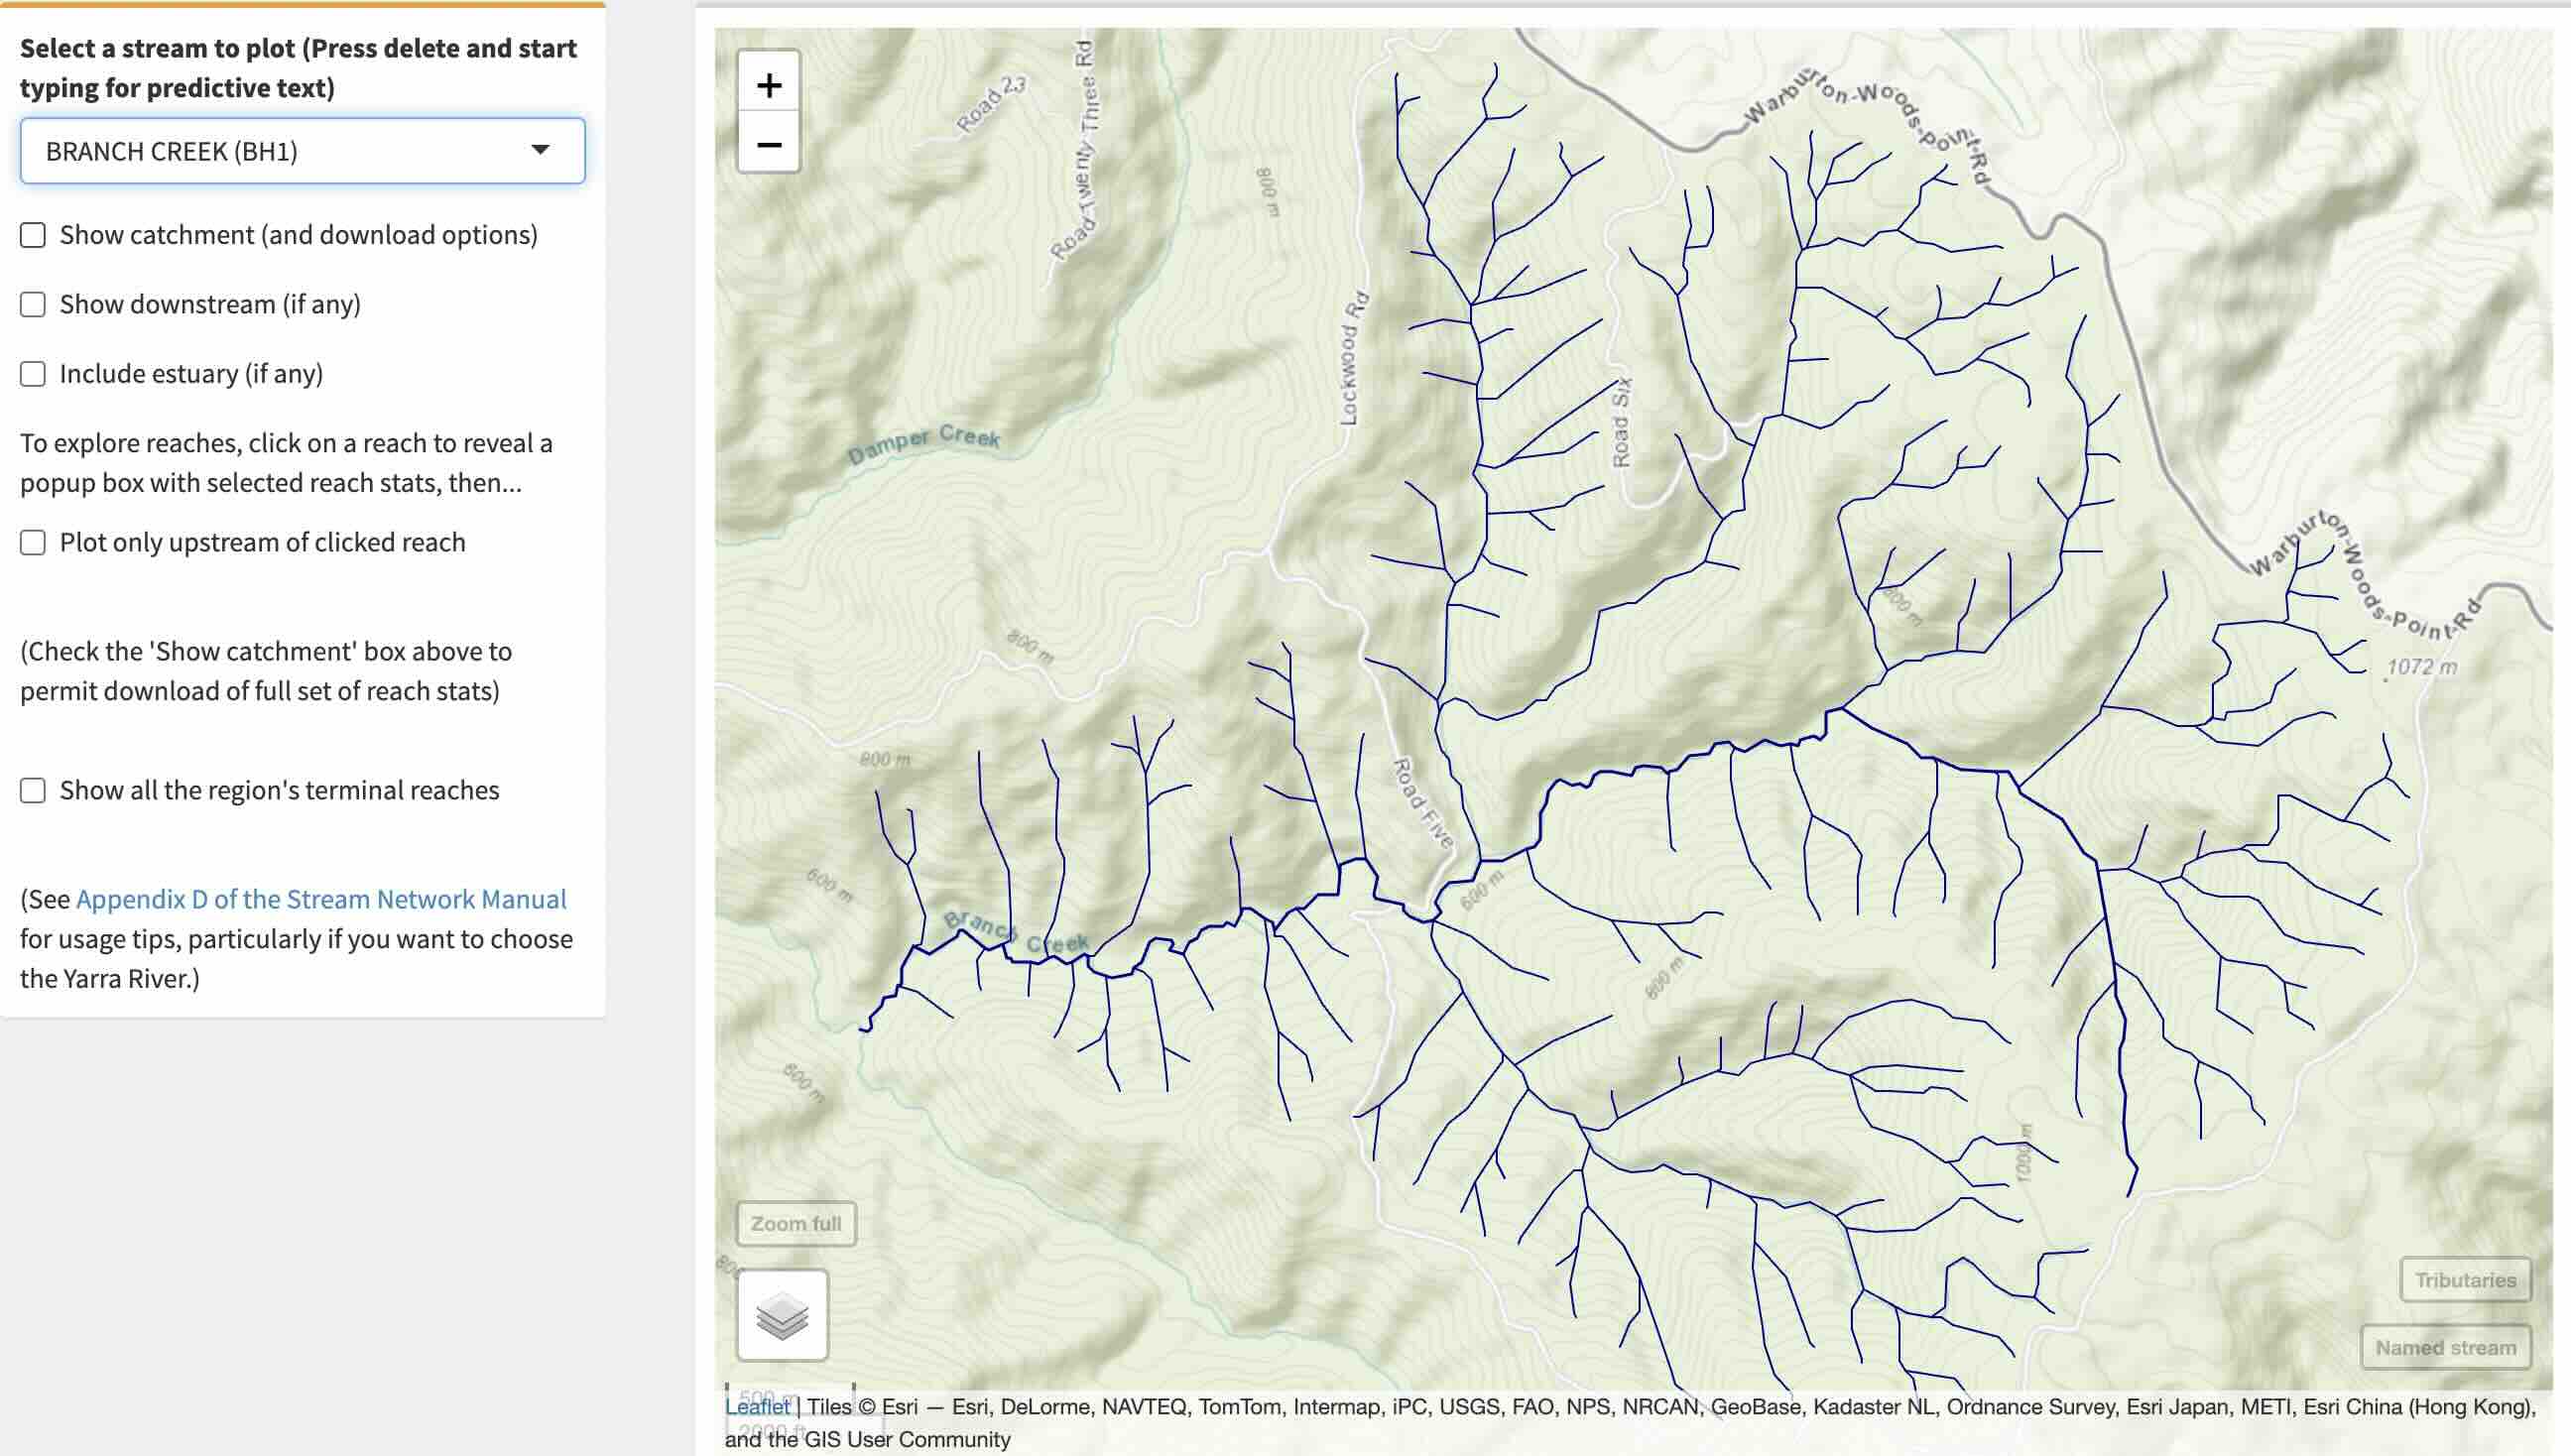
These stream codes are the first three letters of reach and site codes used in other databases like the Melbourne Water Macroinvertebrate Database. If you are dealing with datasets that use these codes, you can quickly search for the stream of interest by entering a strcode. For instance, if you want to know which stream is BH1 and where it is, just enter the code and its name will appear2.

Having typed BH1, press return, or select the suggested name, to show Branch Creek (in the Upper Yarra Reservoir catchment) and its tributaries on the map.
D.2 Explore downstream reaches and tributaries
Having arrived at Branch Creek, if you are curious to know what the stream to its northeast is (and if that stream has a downstream river in common with Branch Creek), you can find out by selecting the Show downstream
checkbox, which, in this case, (alarmingly) reveals the full length of the Yarra downstream…
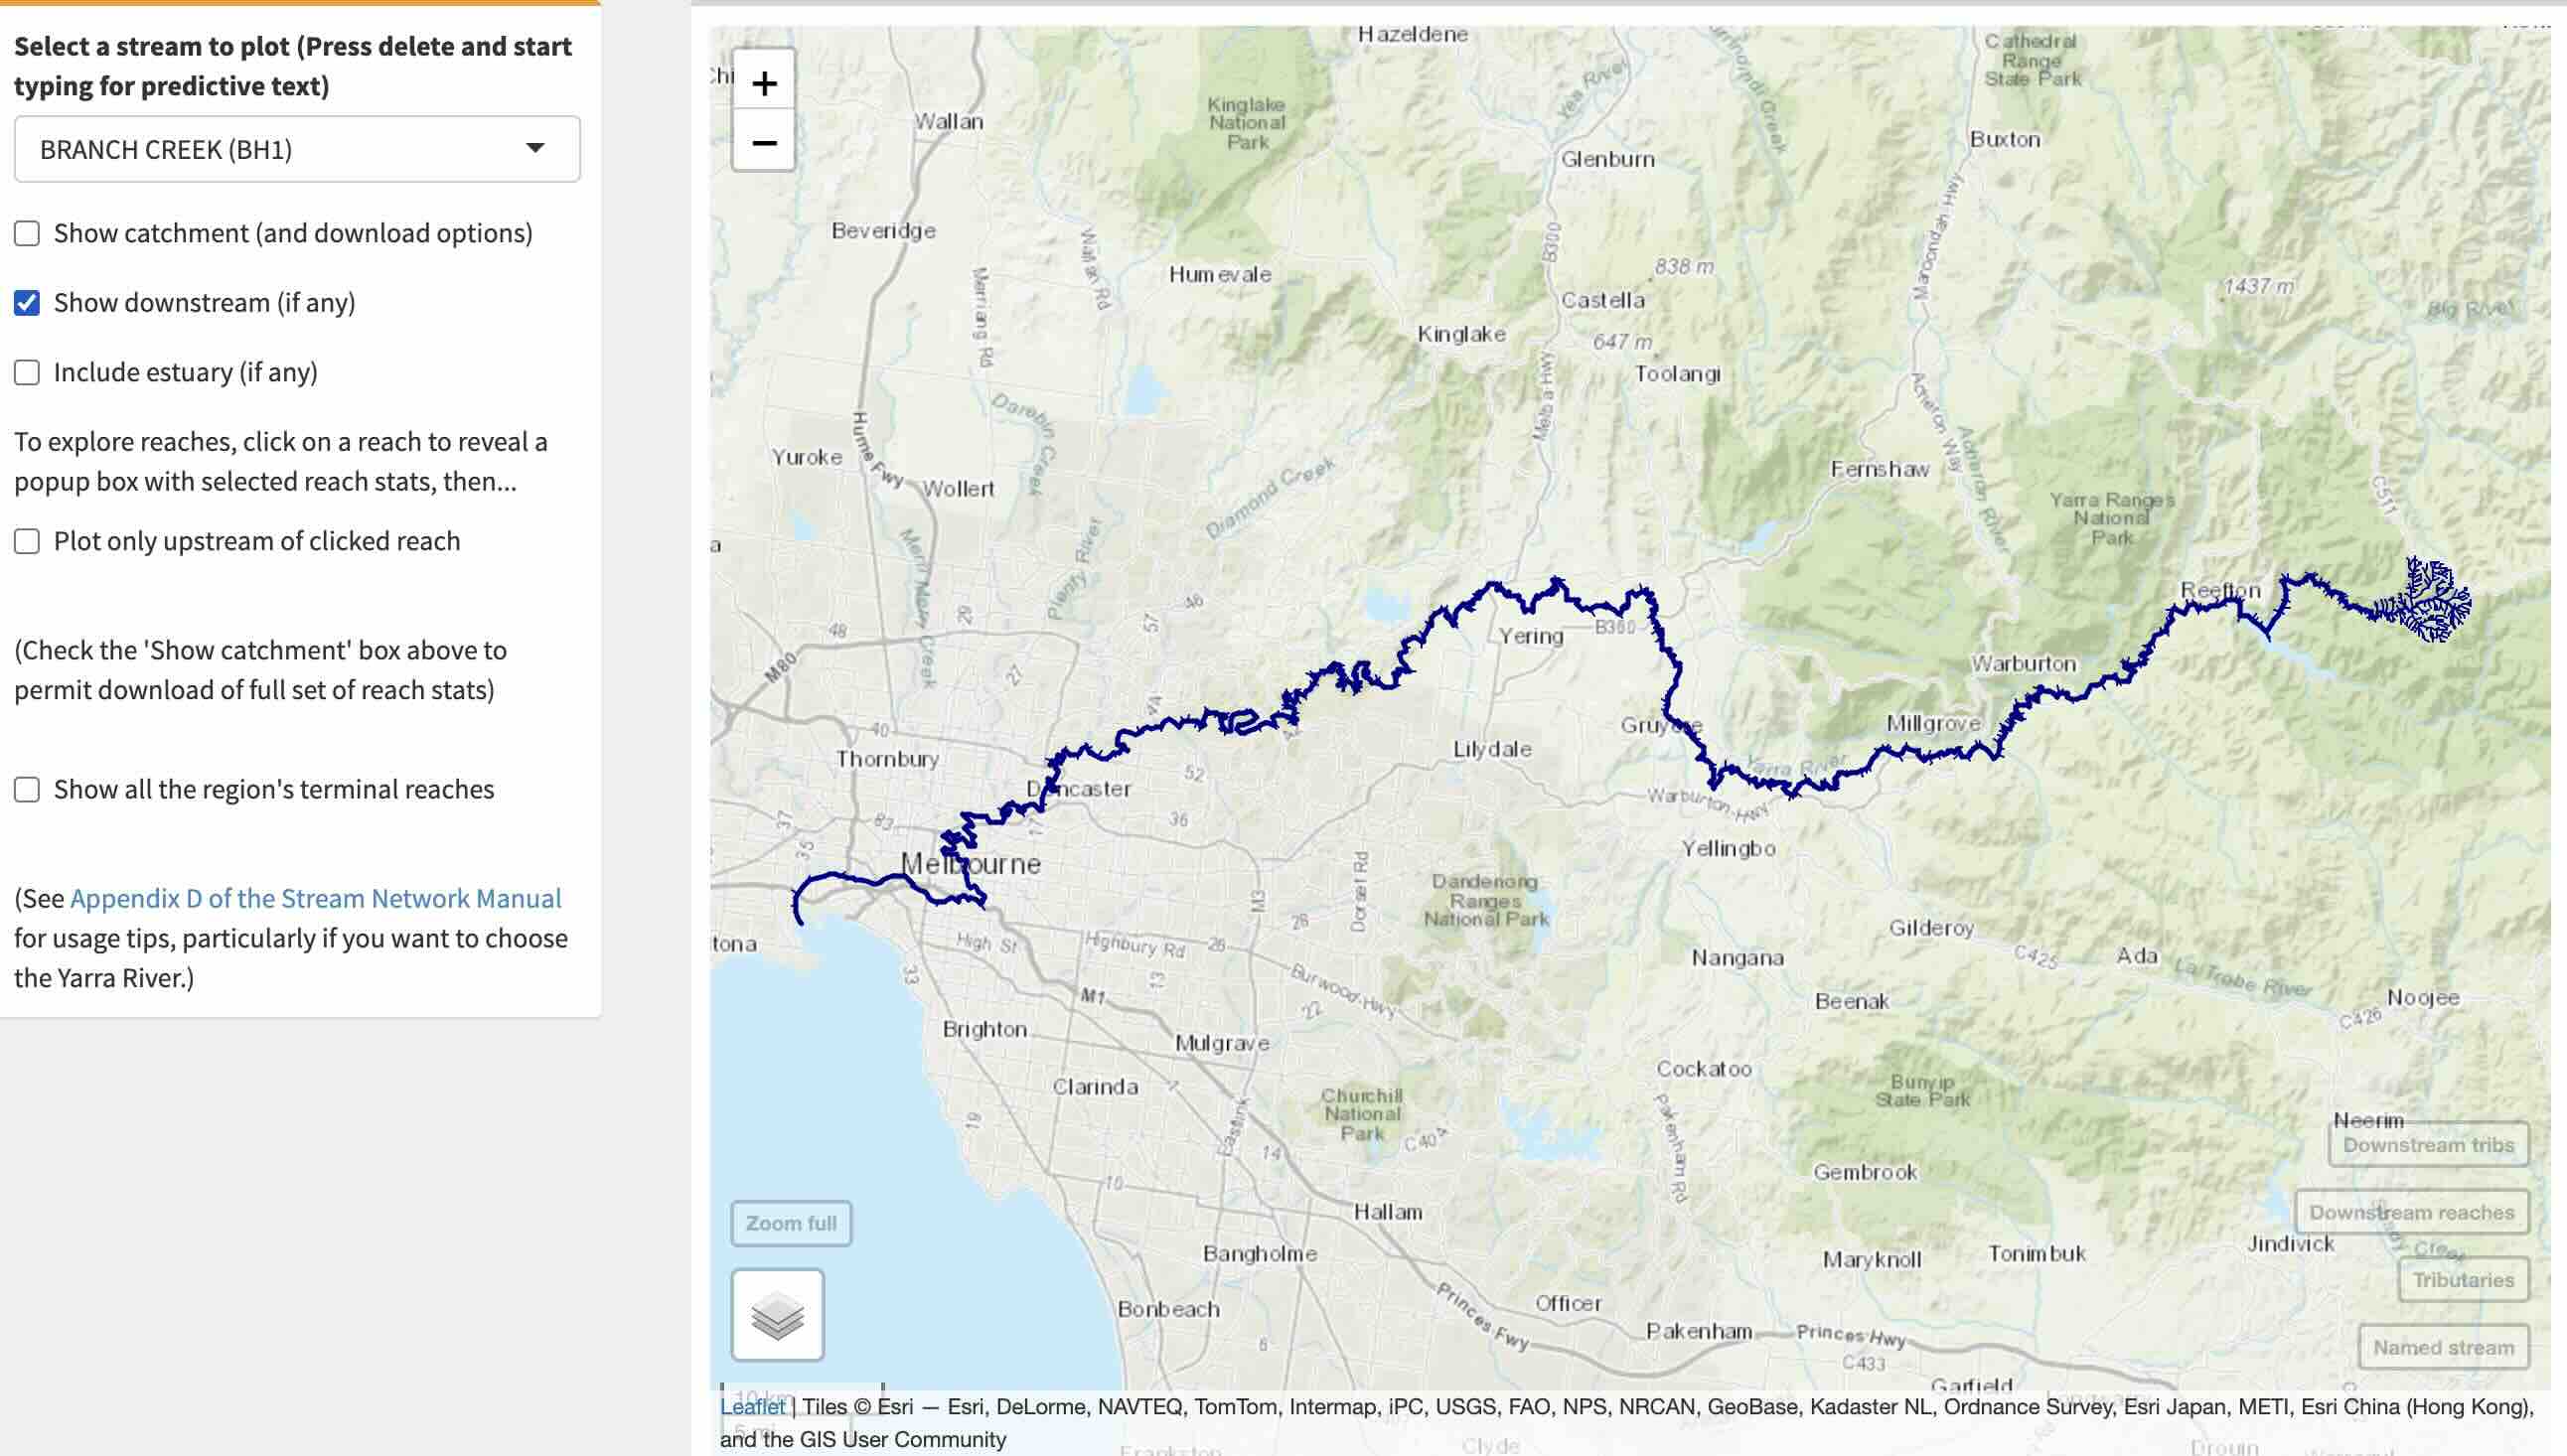
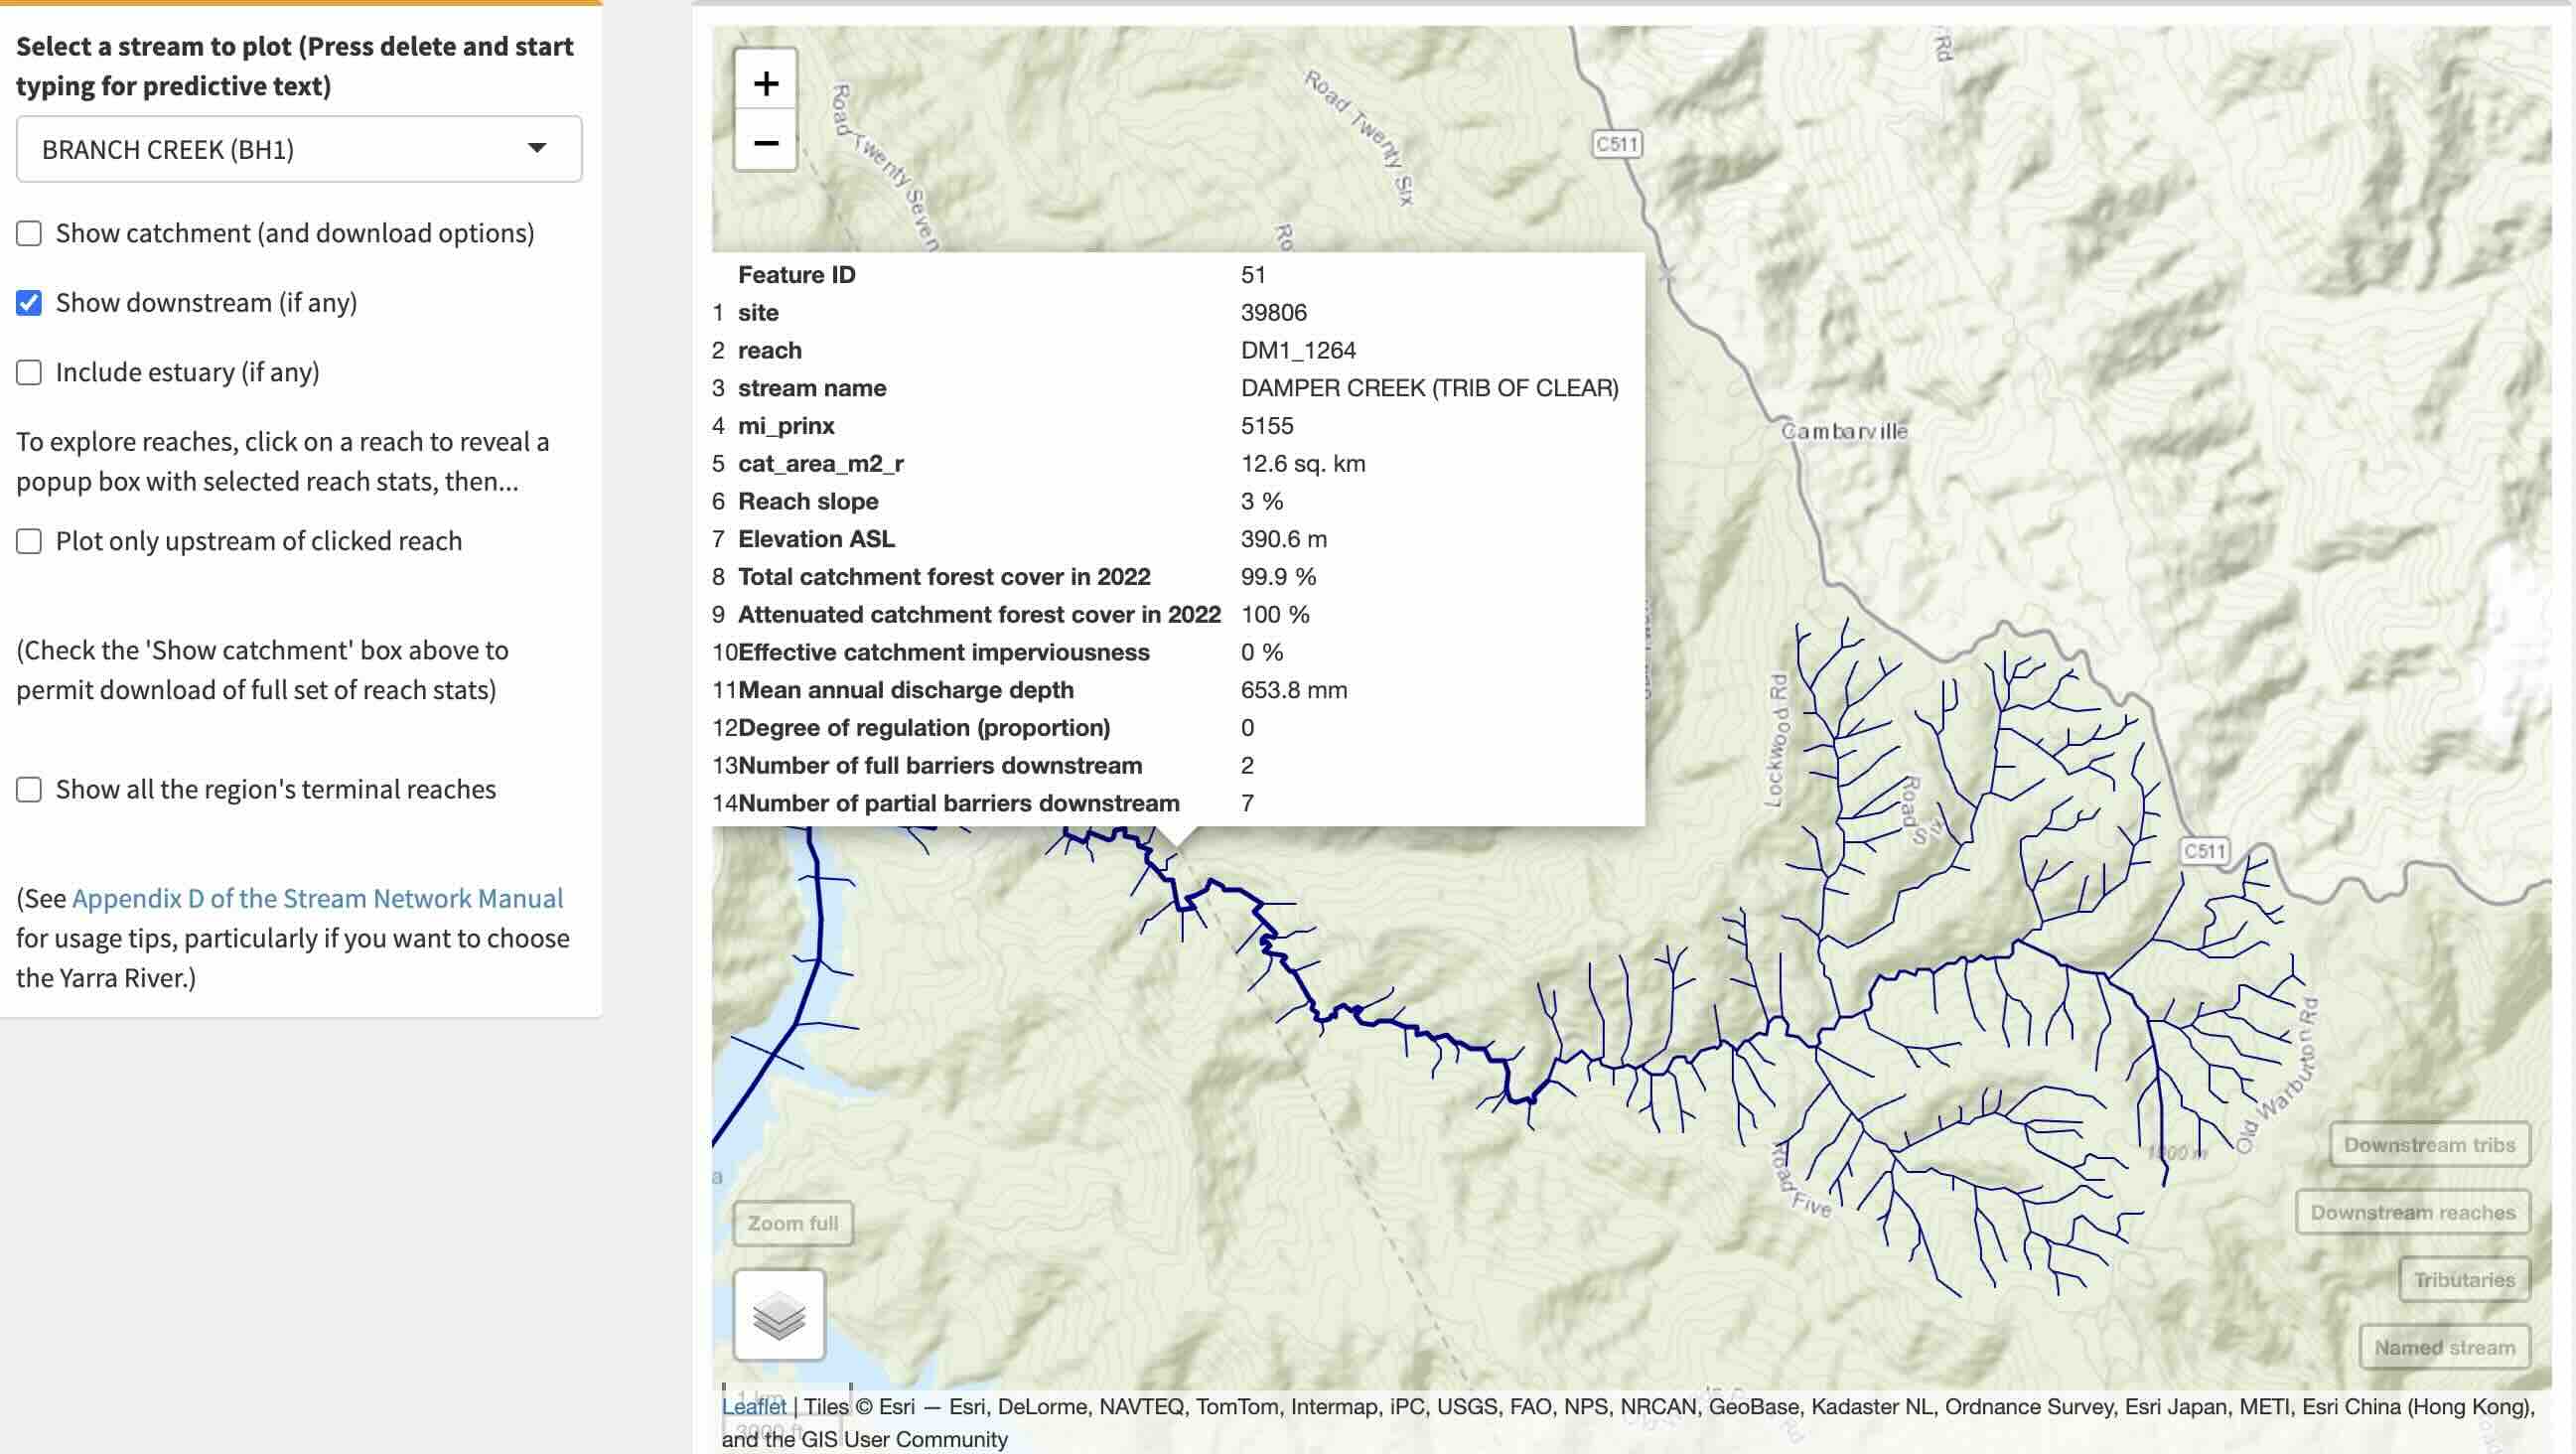
…but if you zoom back into Branch Creek, you can see that the downstream reaches also include the terminal reaches of all downstream tributaries. Clicking on the terminal reach of the stream that heads up the large valley to the north-west shows this tributary to be Damper Creek (Trib of Clear)[app4-mwstr_app-3]…
[app4-mwstr_app-3]: There are two Damper Creeks in the region, thus the additional detail in the name: see Section 3.5
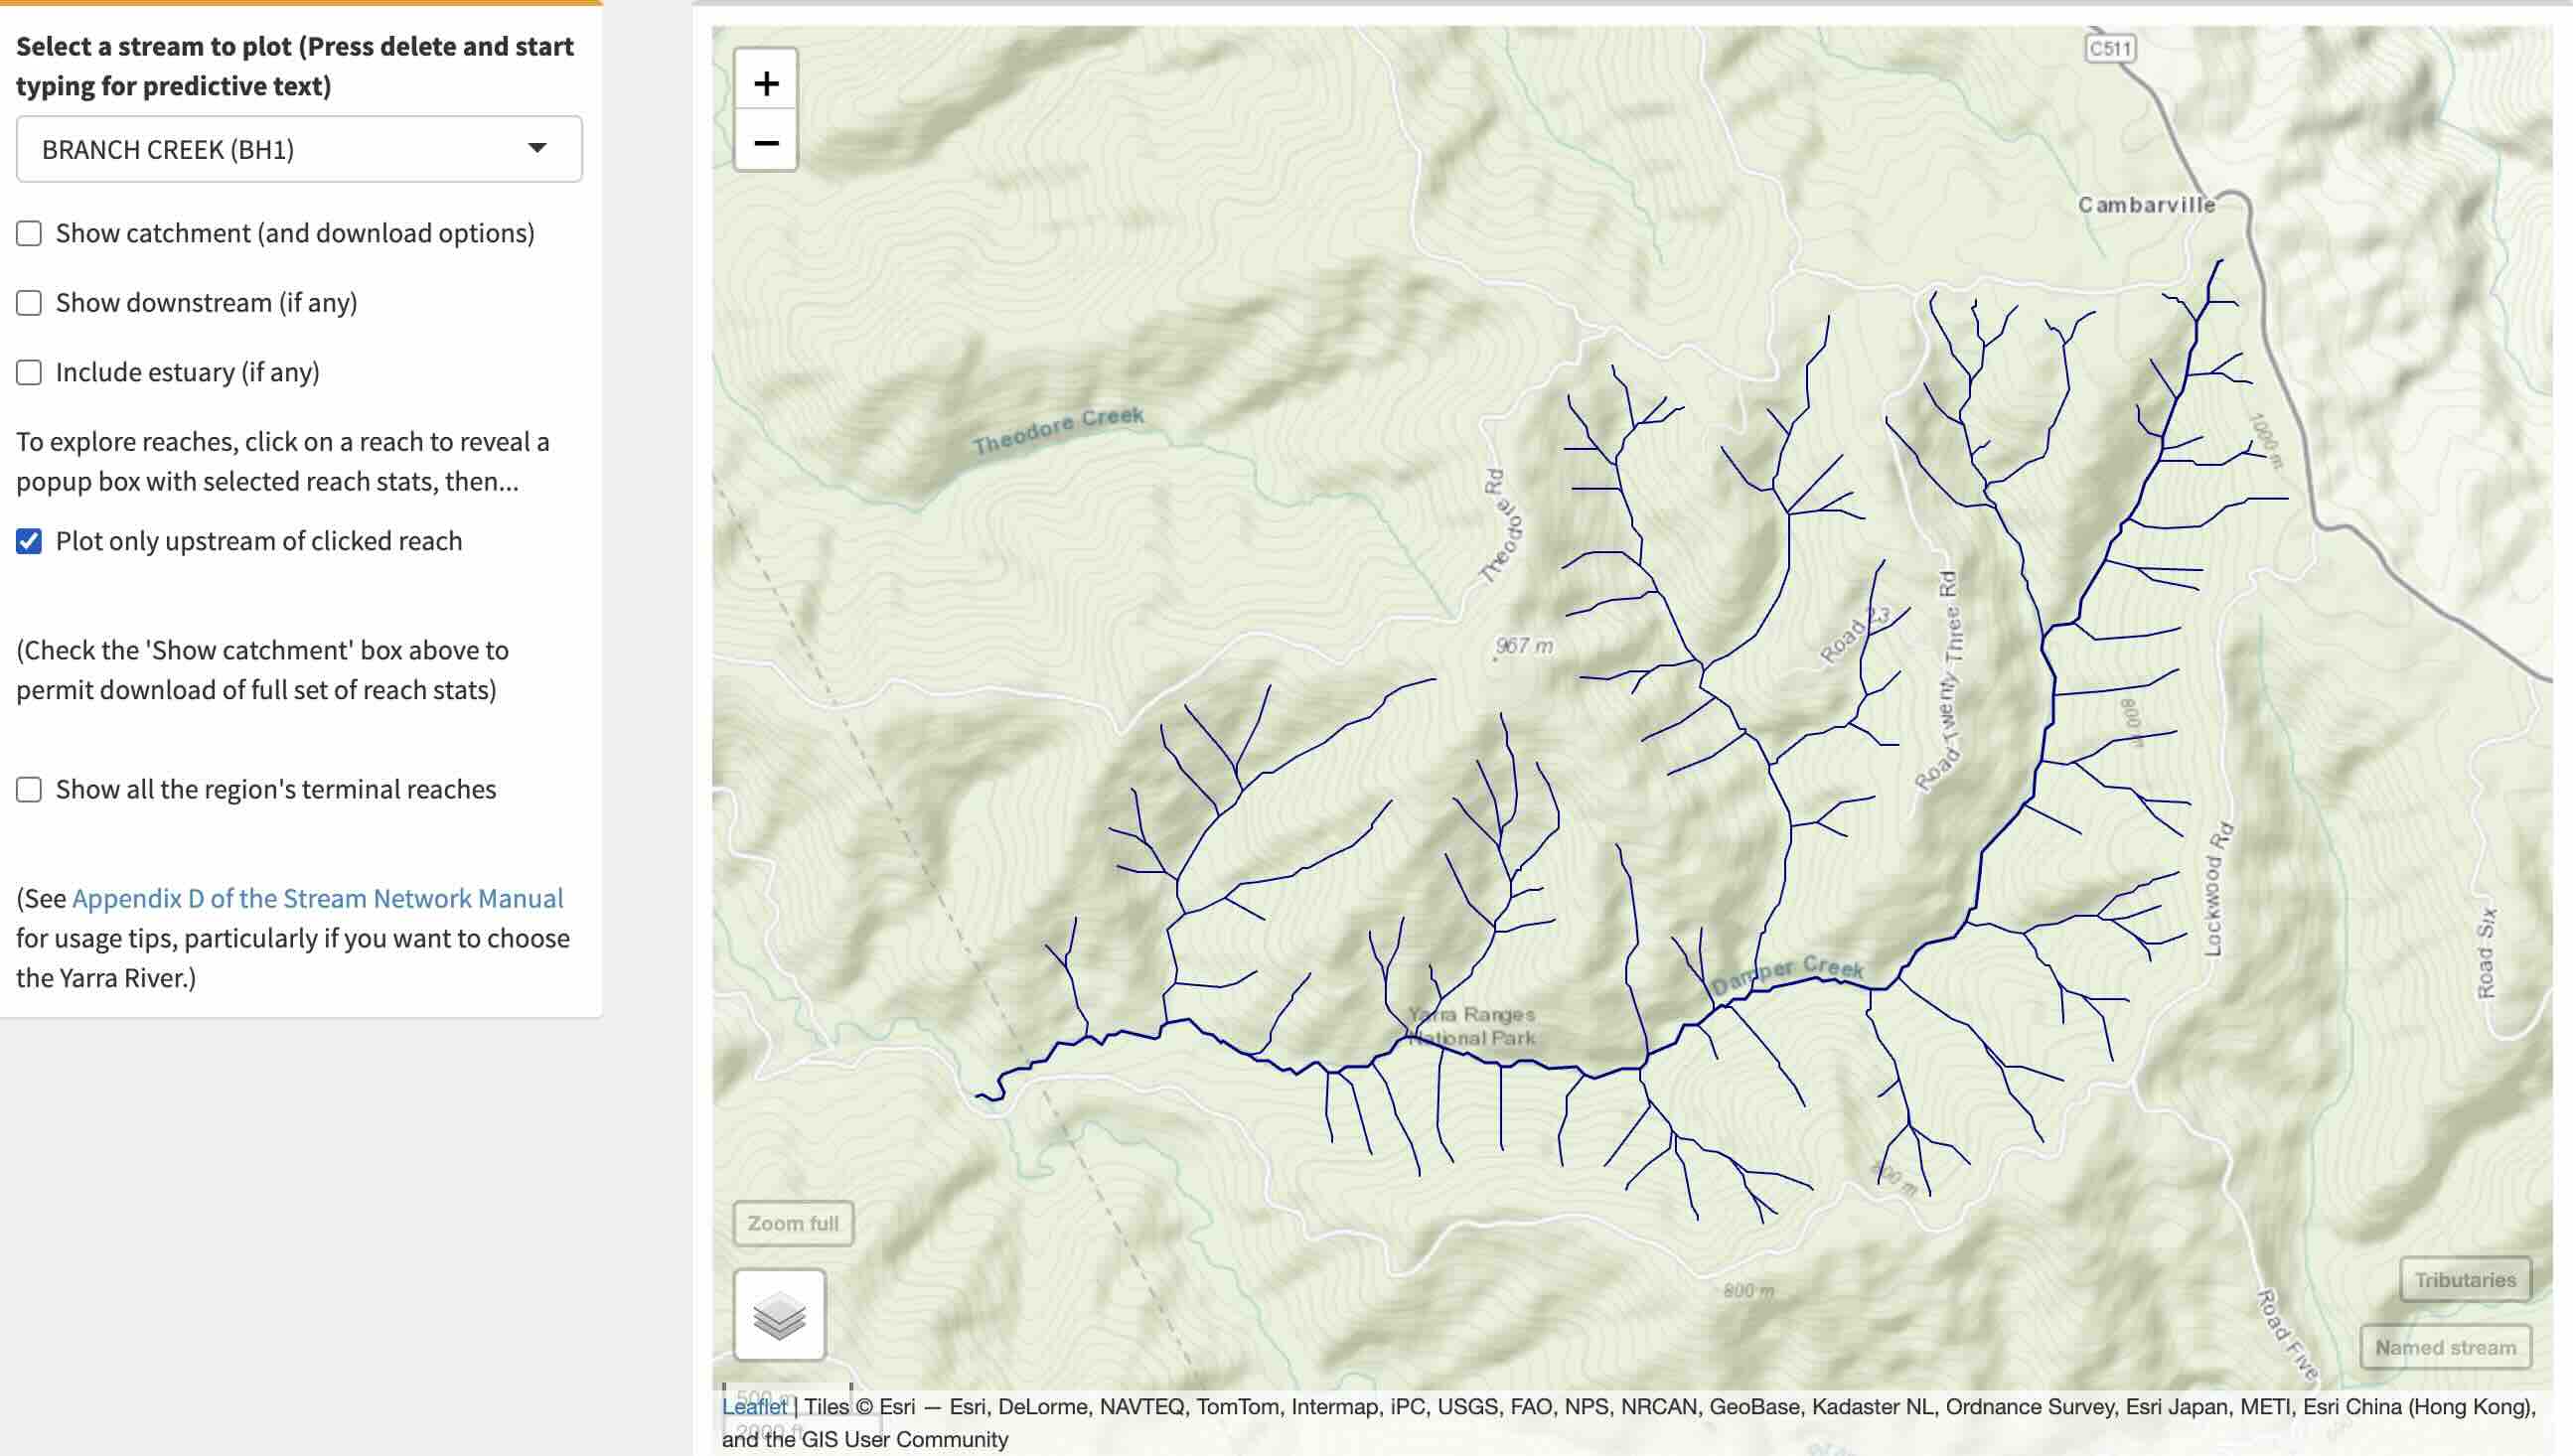
And by then checking the Plot only upstream of clicked reach
option, Damper Creek and its tributaries are mapped.
D.3 Explore any stream or drain and download data
There are more than 130,000 reaches in the stream network map, and the web mapping software does not cope well with displaying such a big dataset of lines all at once (which is why the app is designed to explore primarily stream by stream). If you have no idea of the name of the stream or drain you are interested in, check the Show all the region’s terminal reaches
option (that is, reaches that flow to the sea, or in a few cases to an aqueduct), and uncheck the Plot only upstream of clicked reach
option. This produces a view like this:
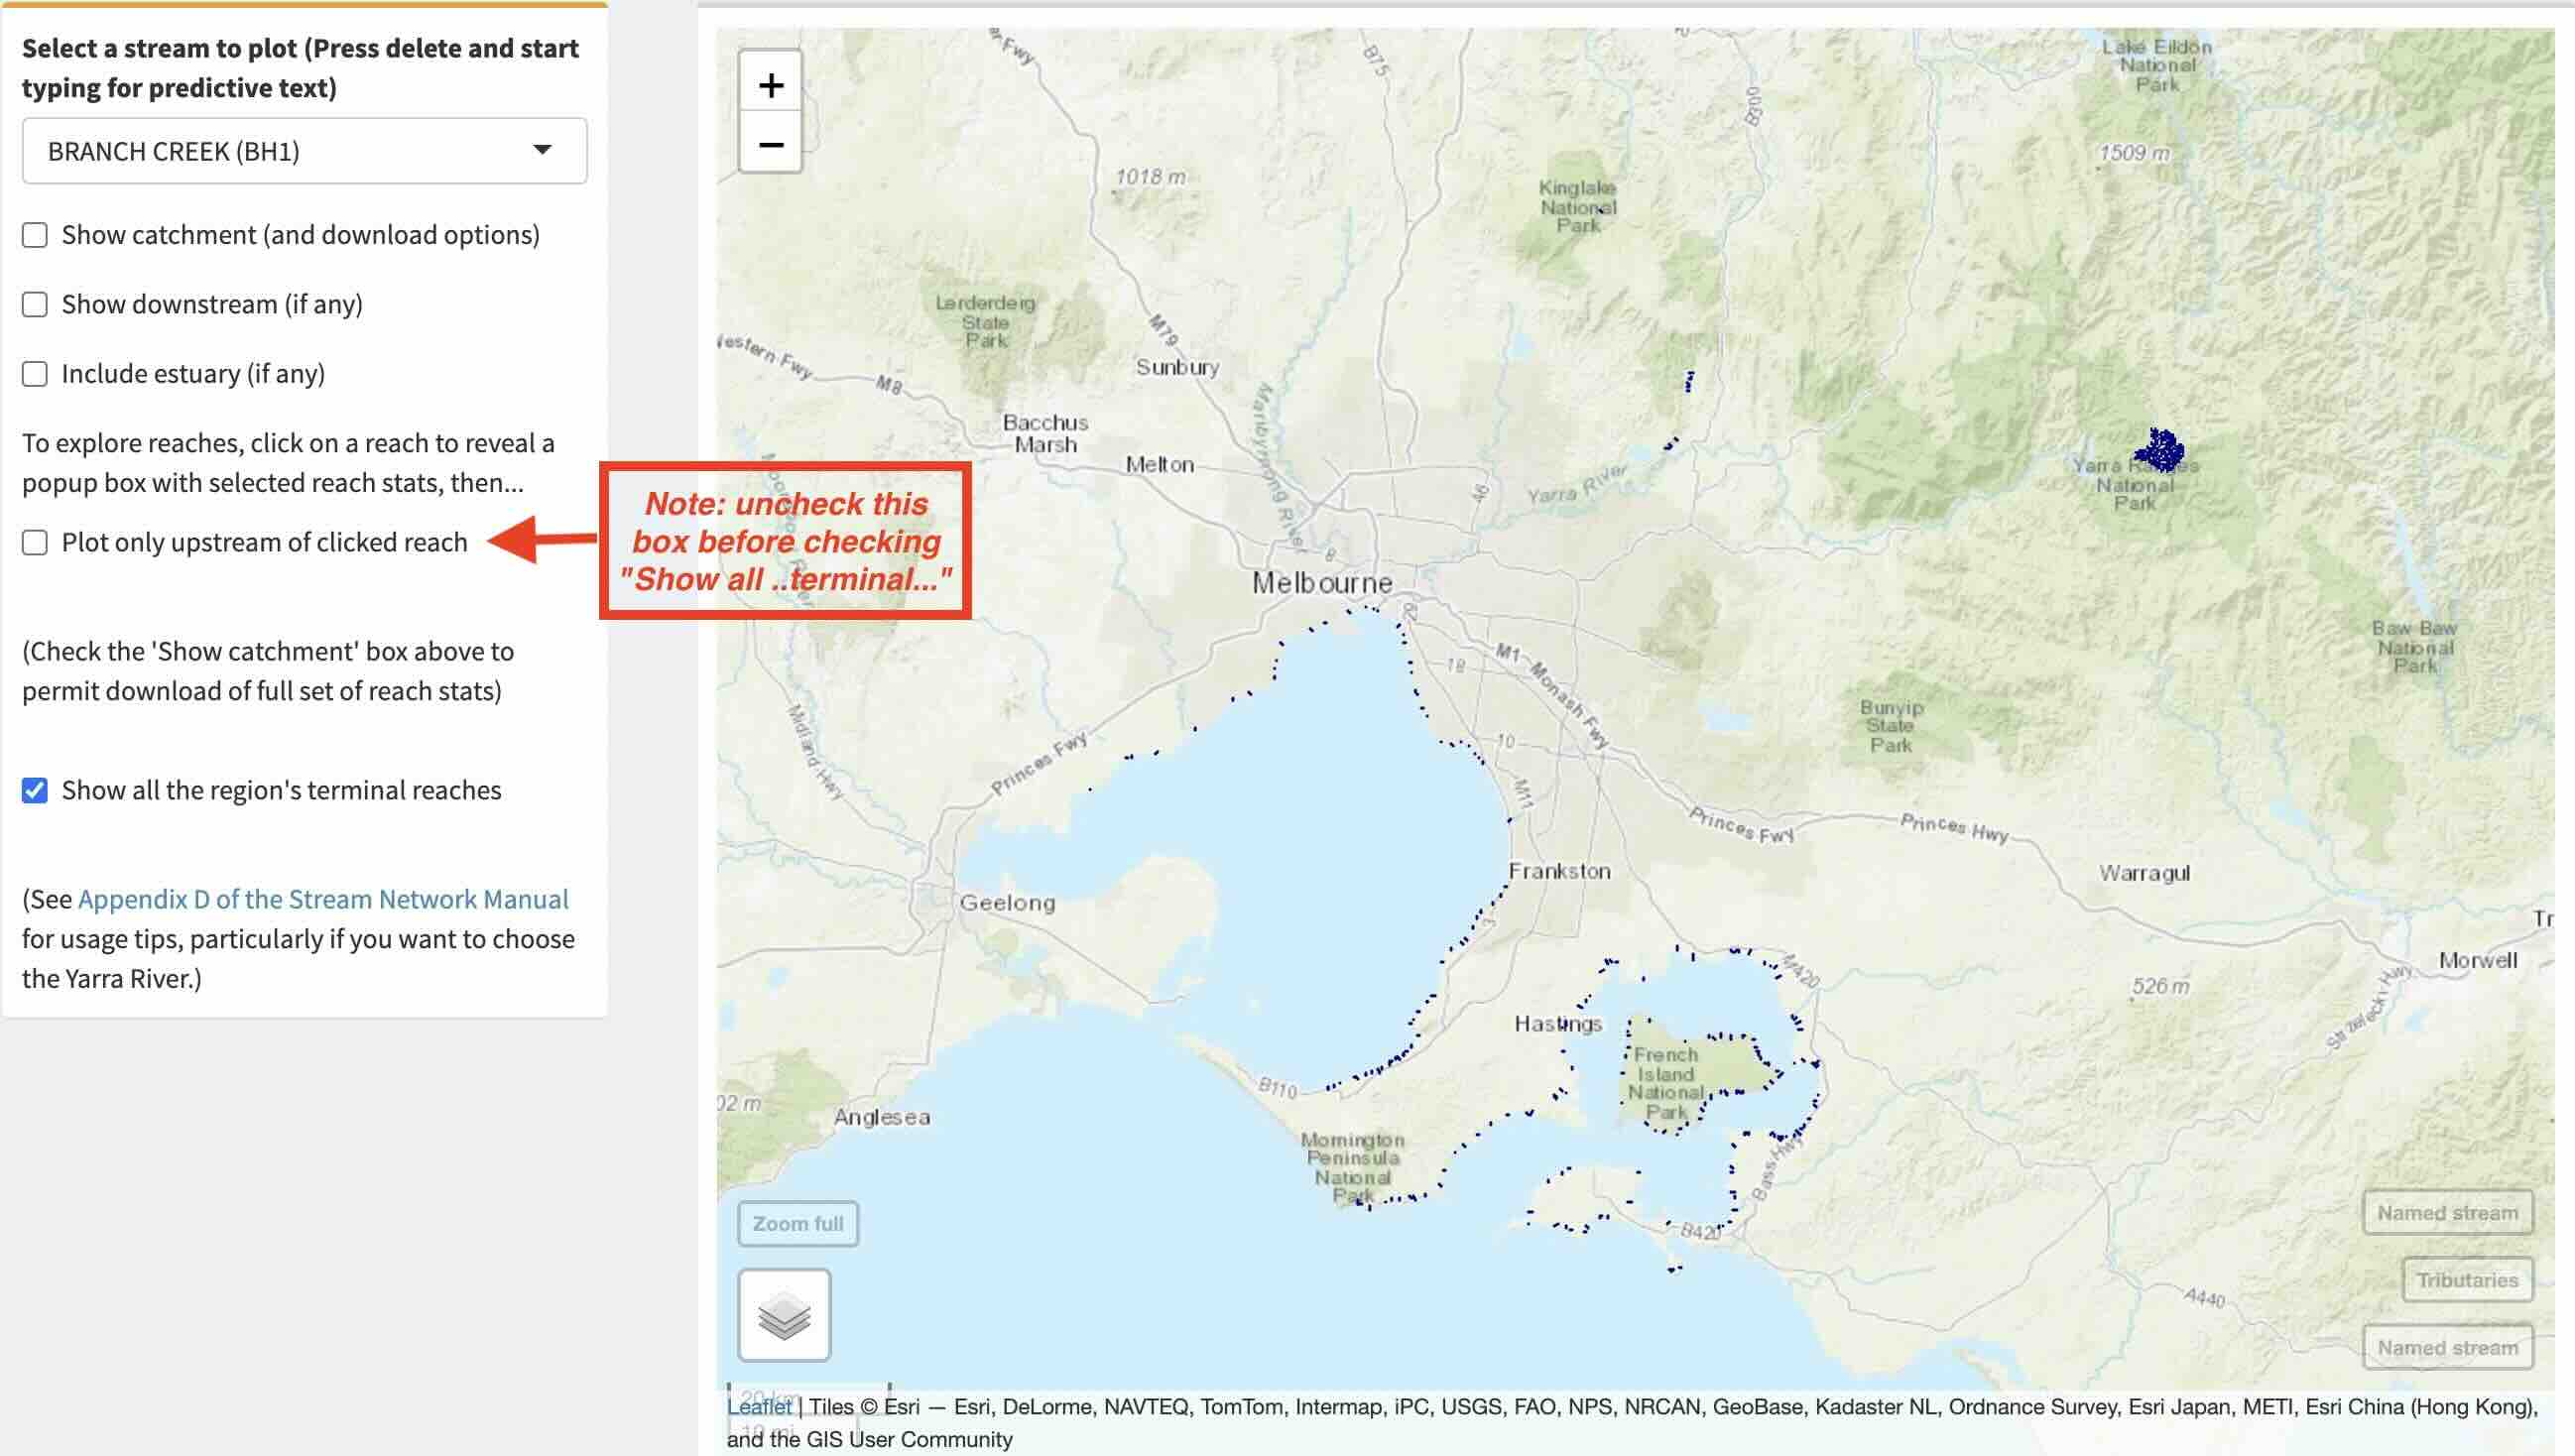
I clicked the option having selected Branch Creek (BH1)
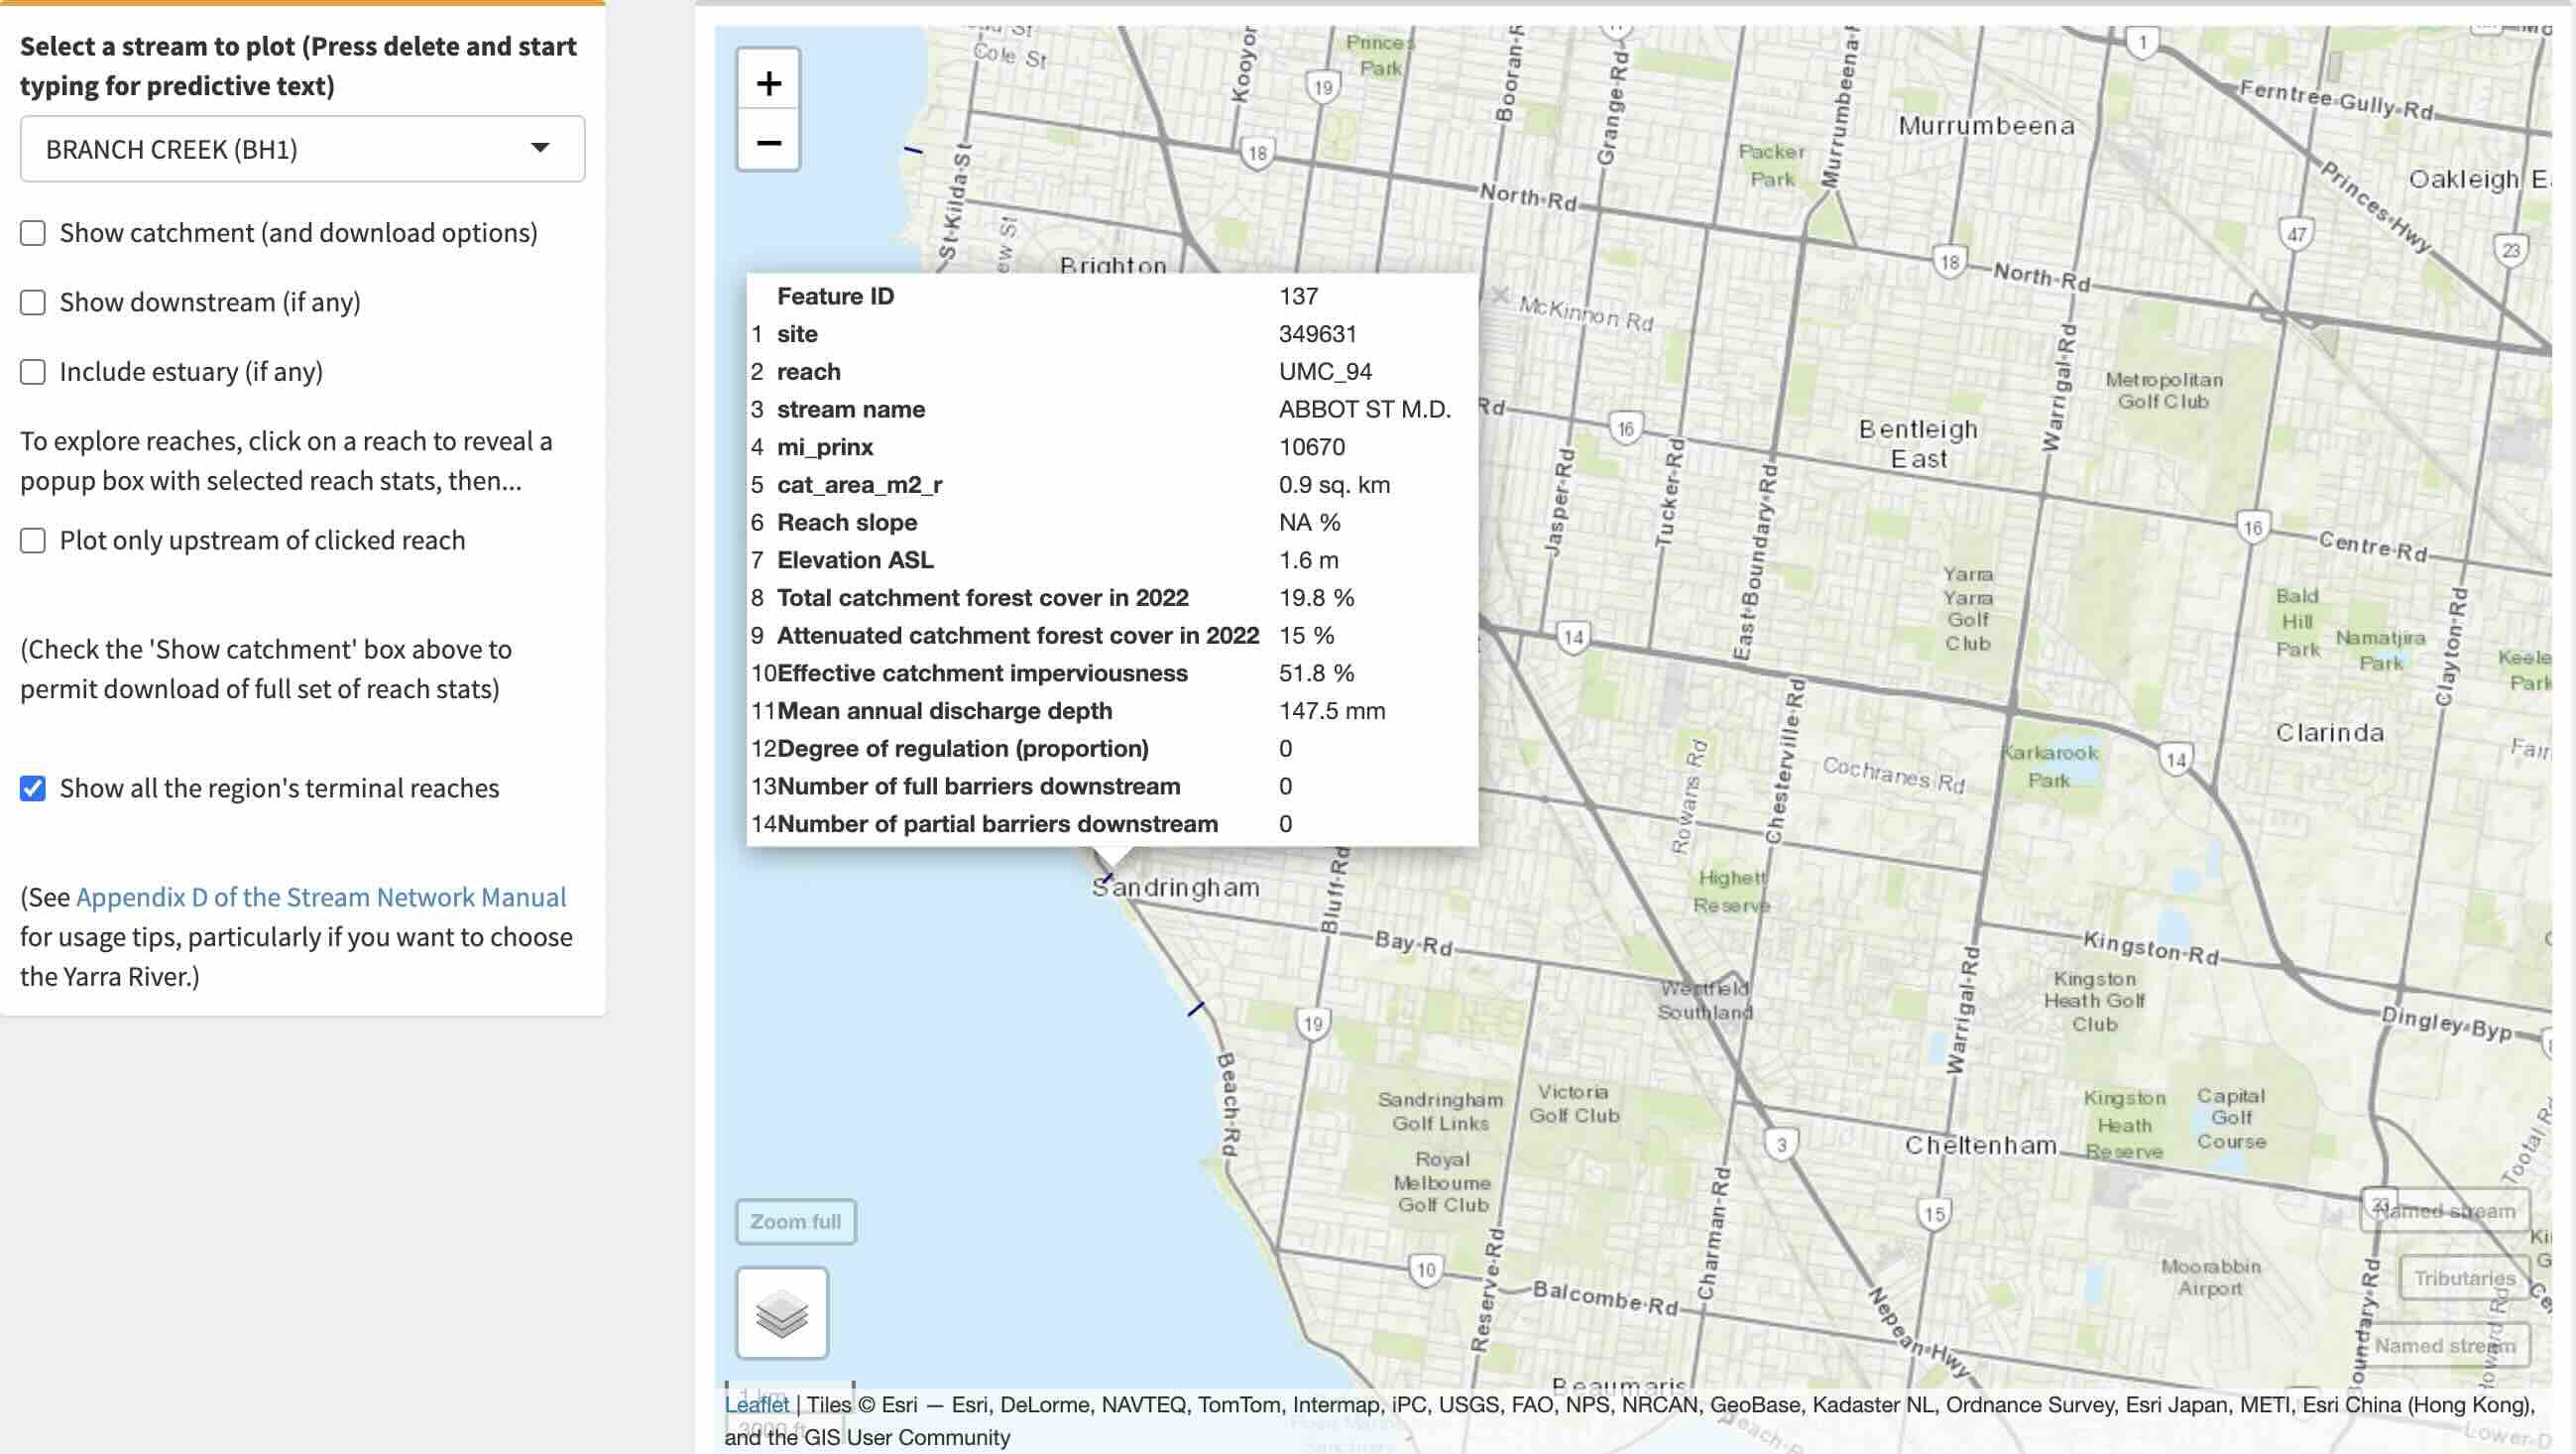
, which is the blue blob on the top right. You can click this option while having any other selection active. Note all of the small blue line segments around the coast (and a few inland). By selecting larger stream outlets, you can display all of their tributaries and search for your stream of interest3. If you were interested in knowing the catchment of the drain that enters Port Phillip Bay at Sandringham beach, zoom in and click on it to reveal it as the Abbot Street Main Drain (with some environmental attributes displayed: see below).
 To plot the catchment of the selected Abbot Street Main Drain, re-check the
 Plot only upstream of clicked reach
option again (this will automatically uncheck the Show all the region’s terminal reaches
option), and check Show catchment (and download options)
.
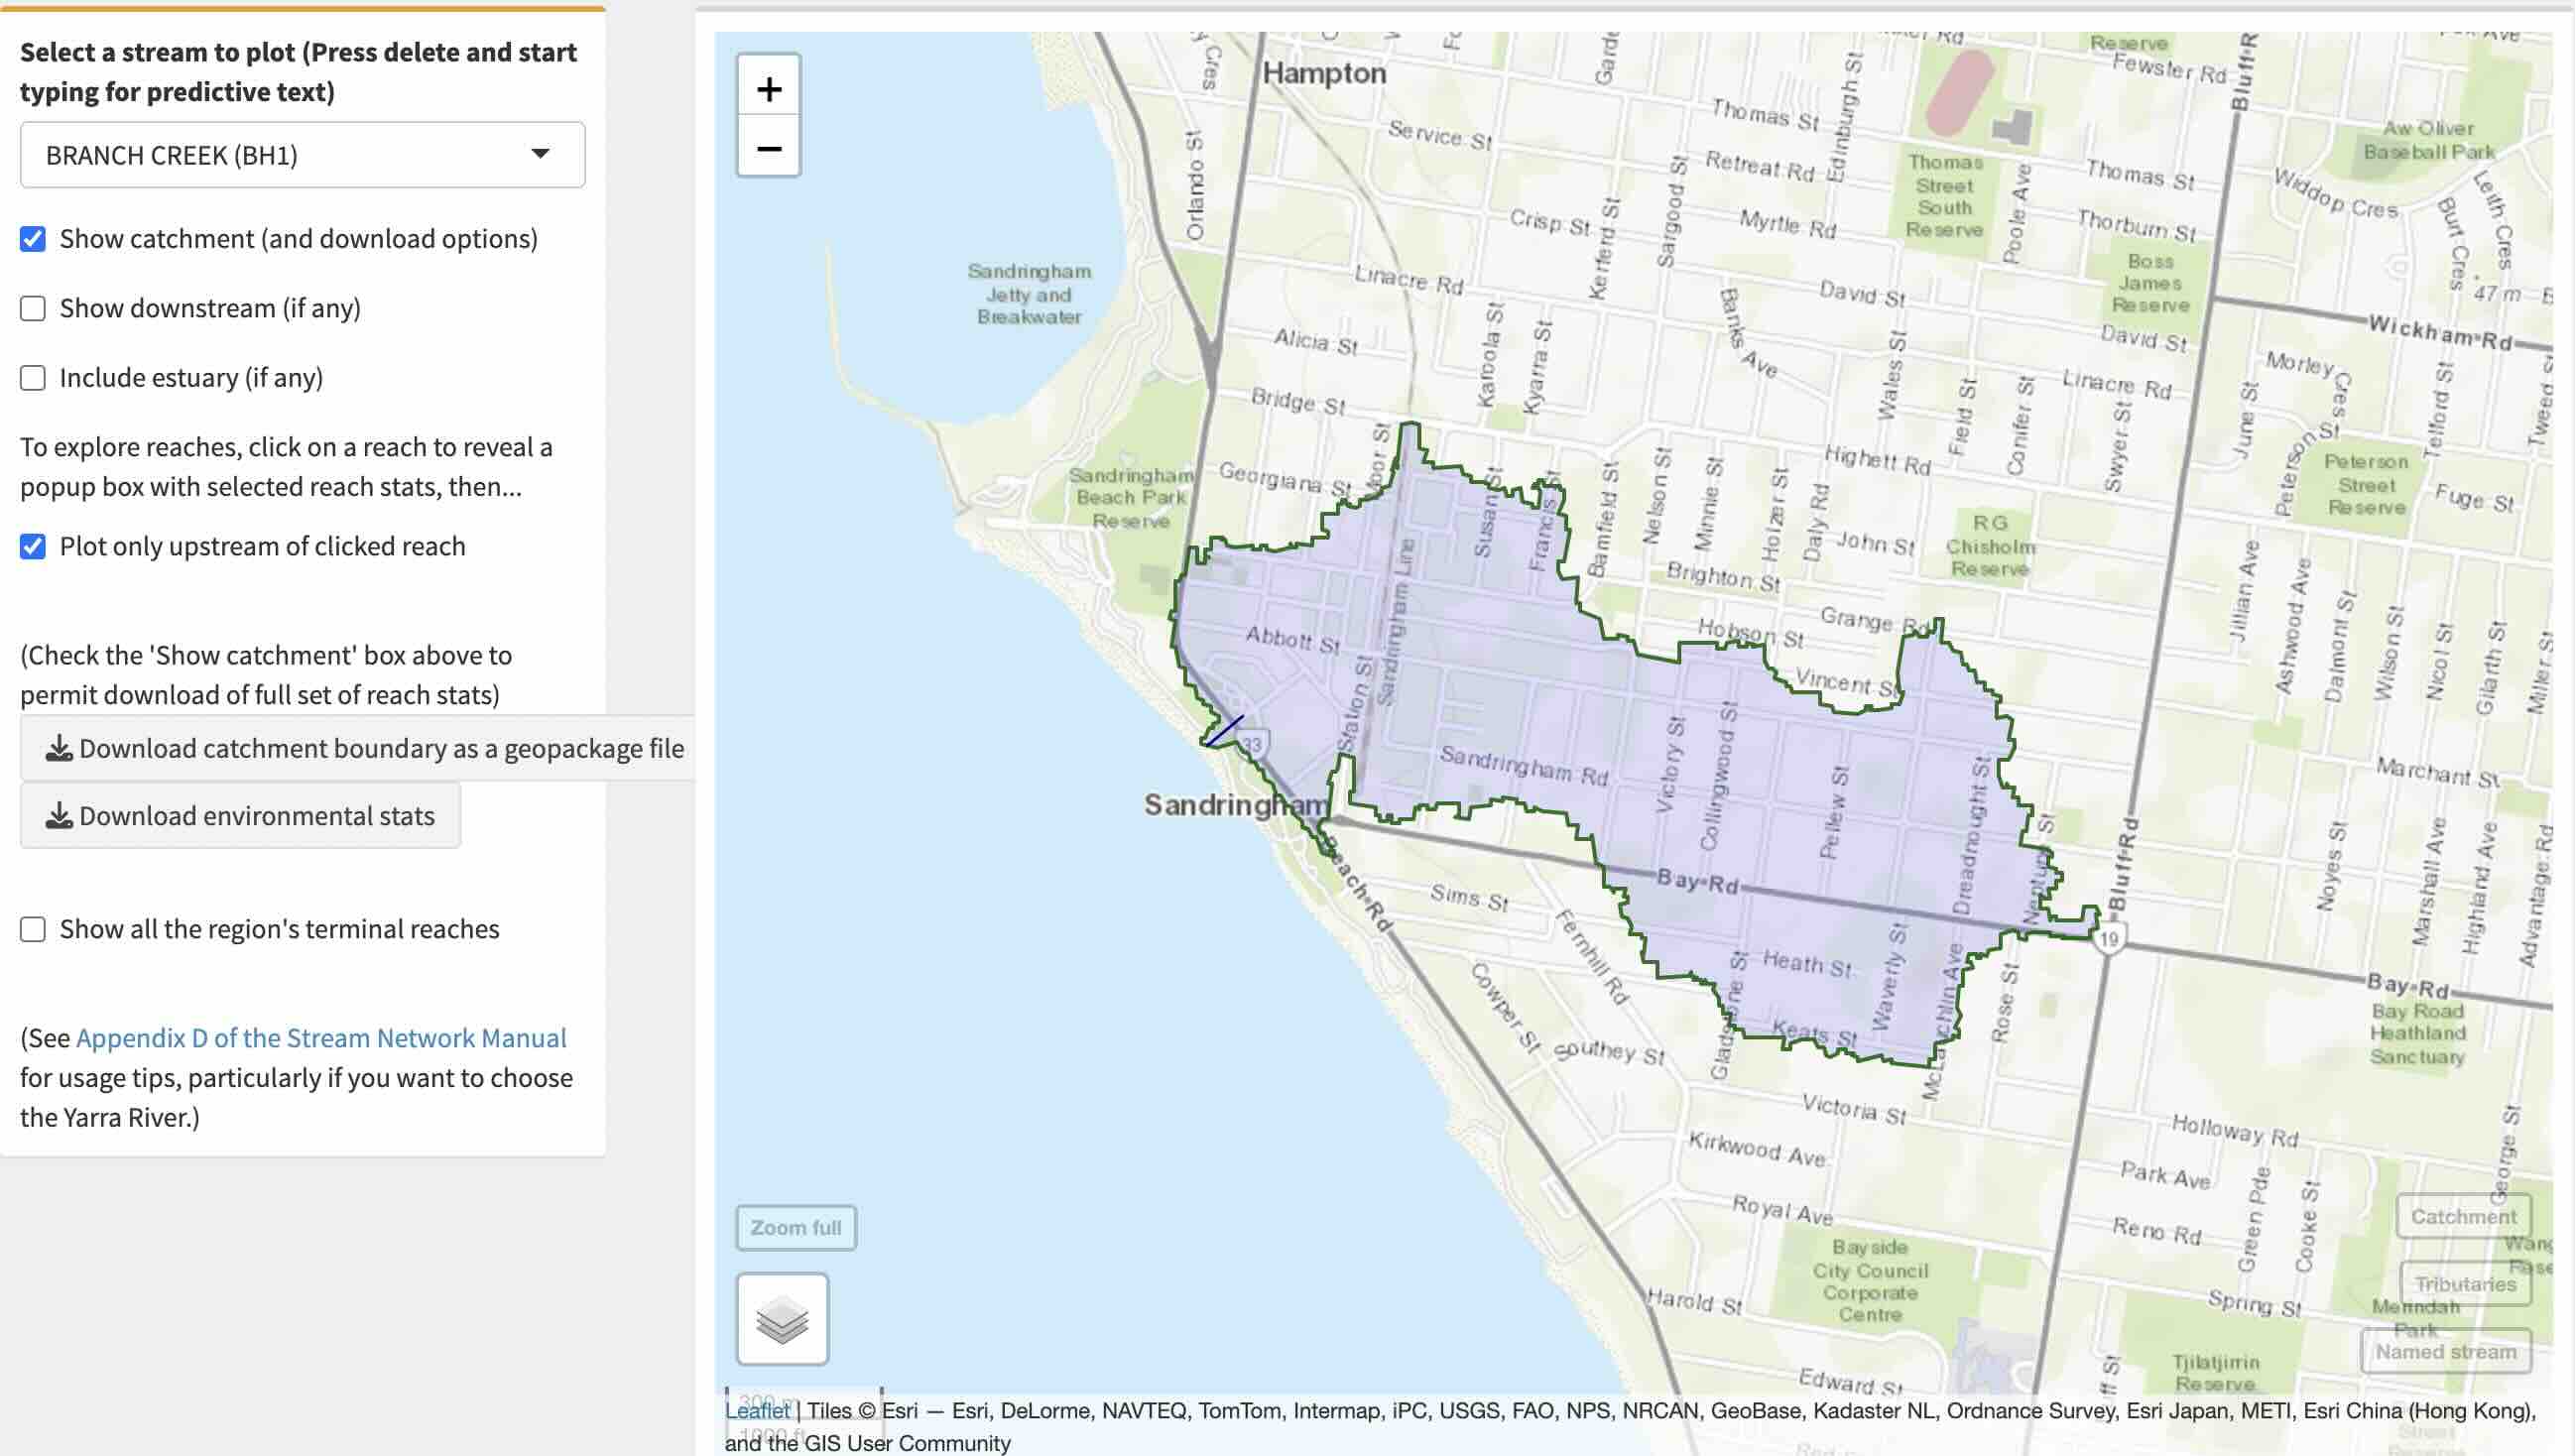 As well as displaying the catchment of the selected reach, you are now given the options to download a geopackage file of the catchment boundary and an excel file of all environmental data for the reach from the tables subc_env and cat_env. The most commonly used environmental attributes are displayed in the popup boxes that appear when a reach is selected. The excel file gives full definitions of each attribute code (with further information on their derivation throughout this manual).
D.4 Dealing with the Yarra River
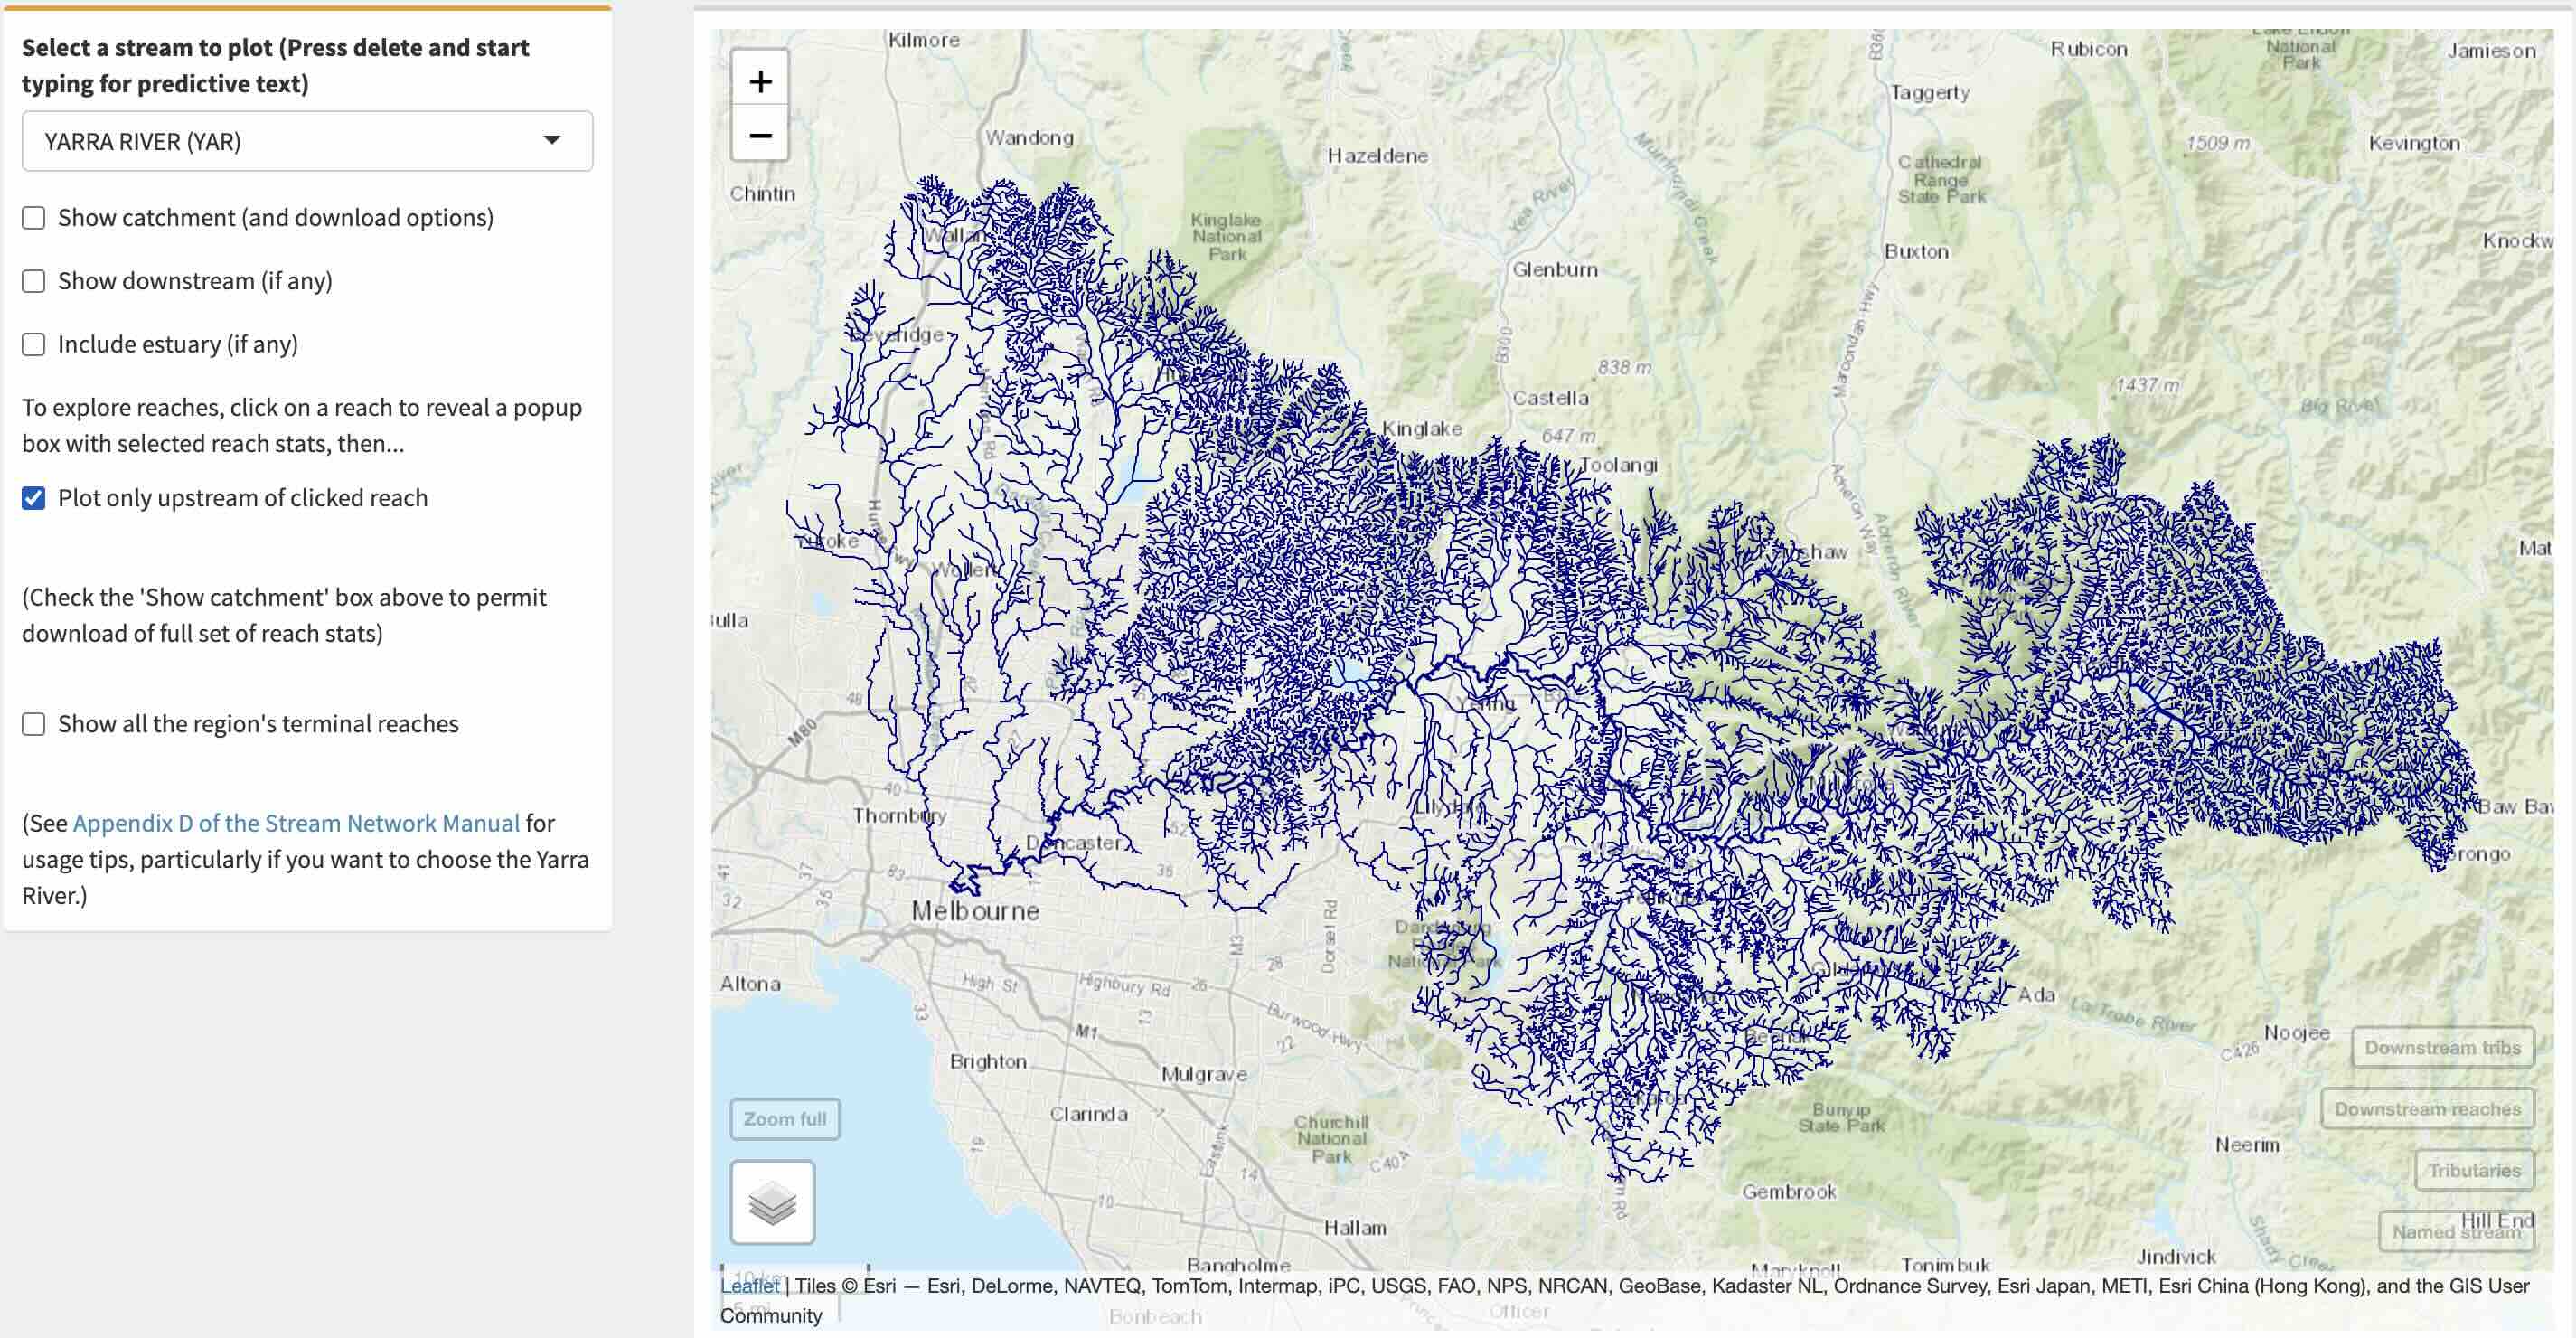
In earlier versions of the app, the Yarra River was a problem because it is so big (its catchment is more than one-third of the whole region). It took a long time to plot, and tended to make the app unstable once loaded. I have now set it so that selecting YAR
in the Select a Stream
box, plots the full length of the main-stem Yarra, all of the tributaries in the upper ~800 sq km of the Yarra catchment, and the bottom reaches of all tributaries downstream (uncheck other options first).
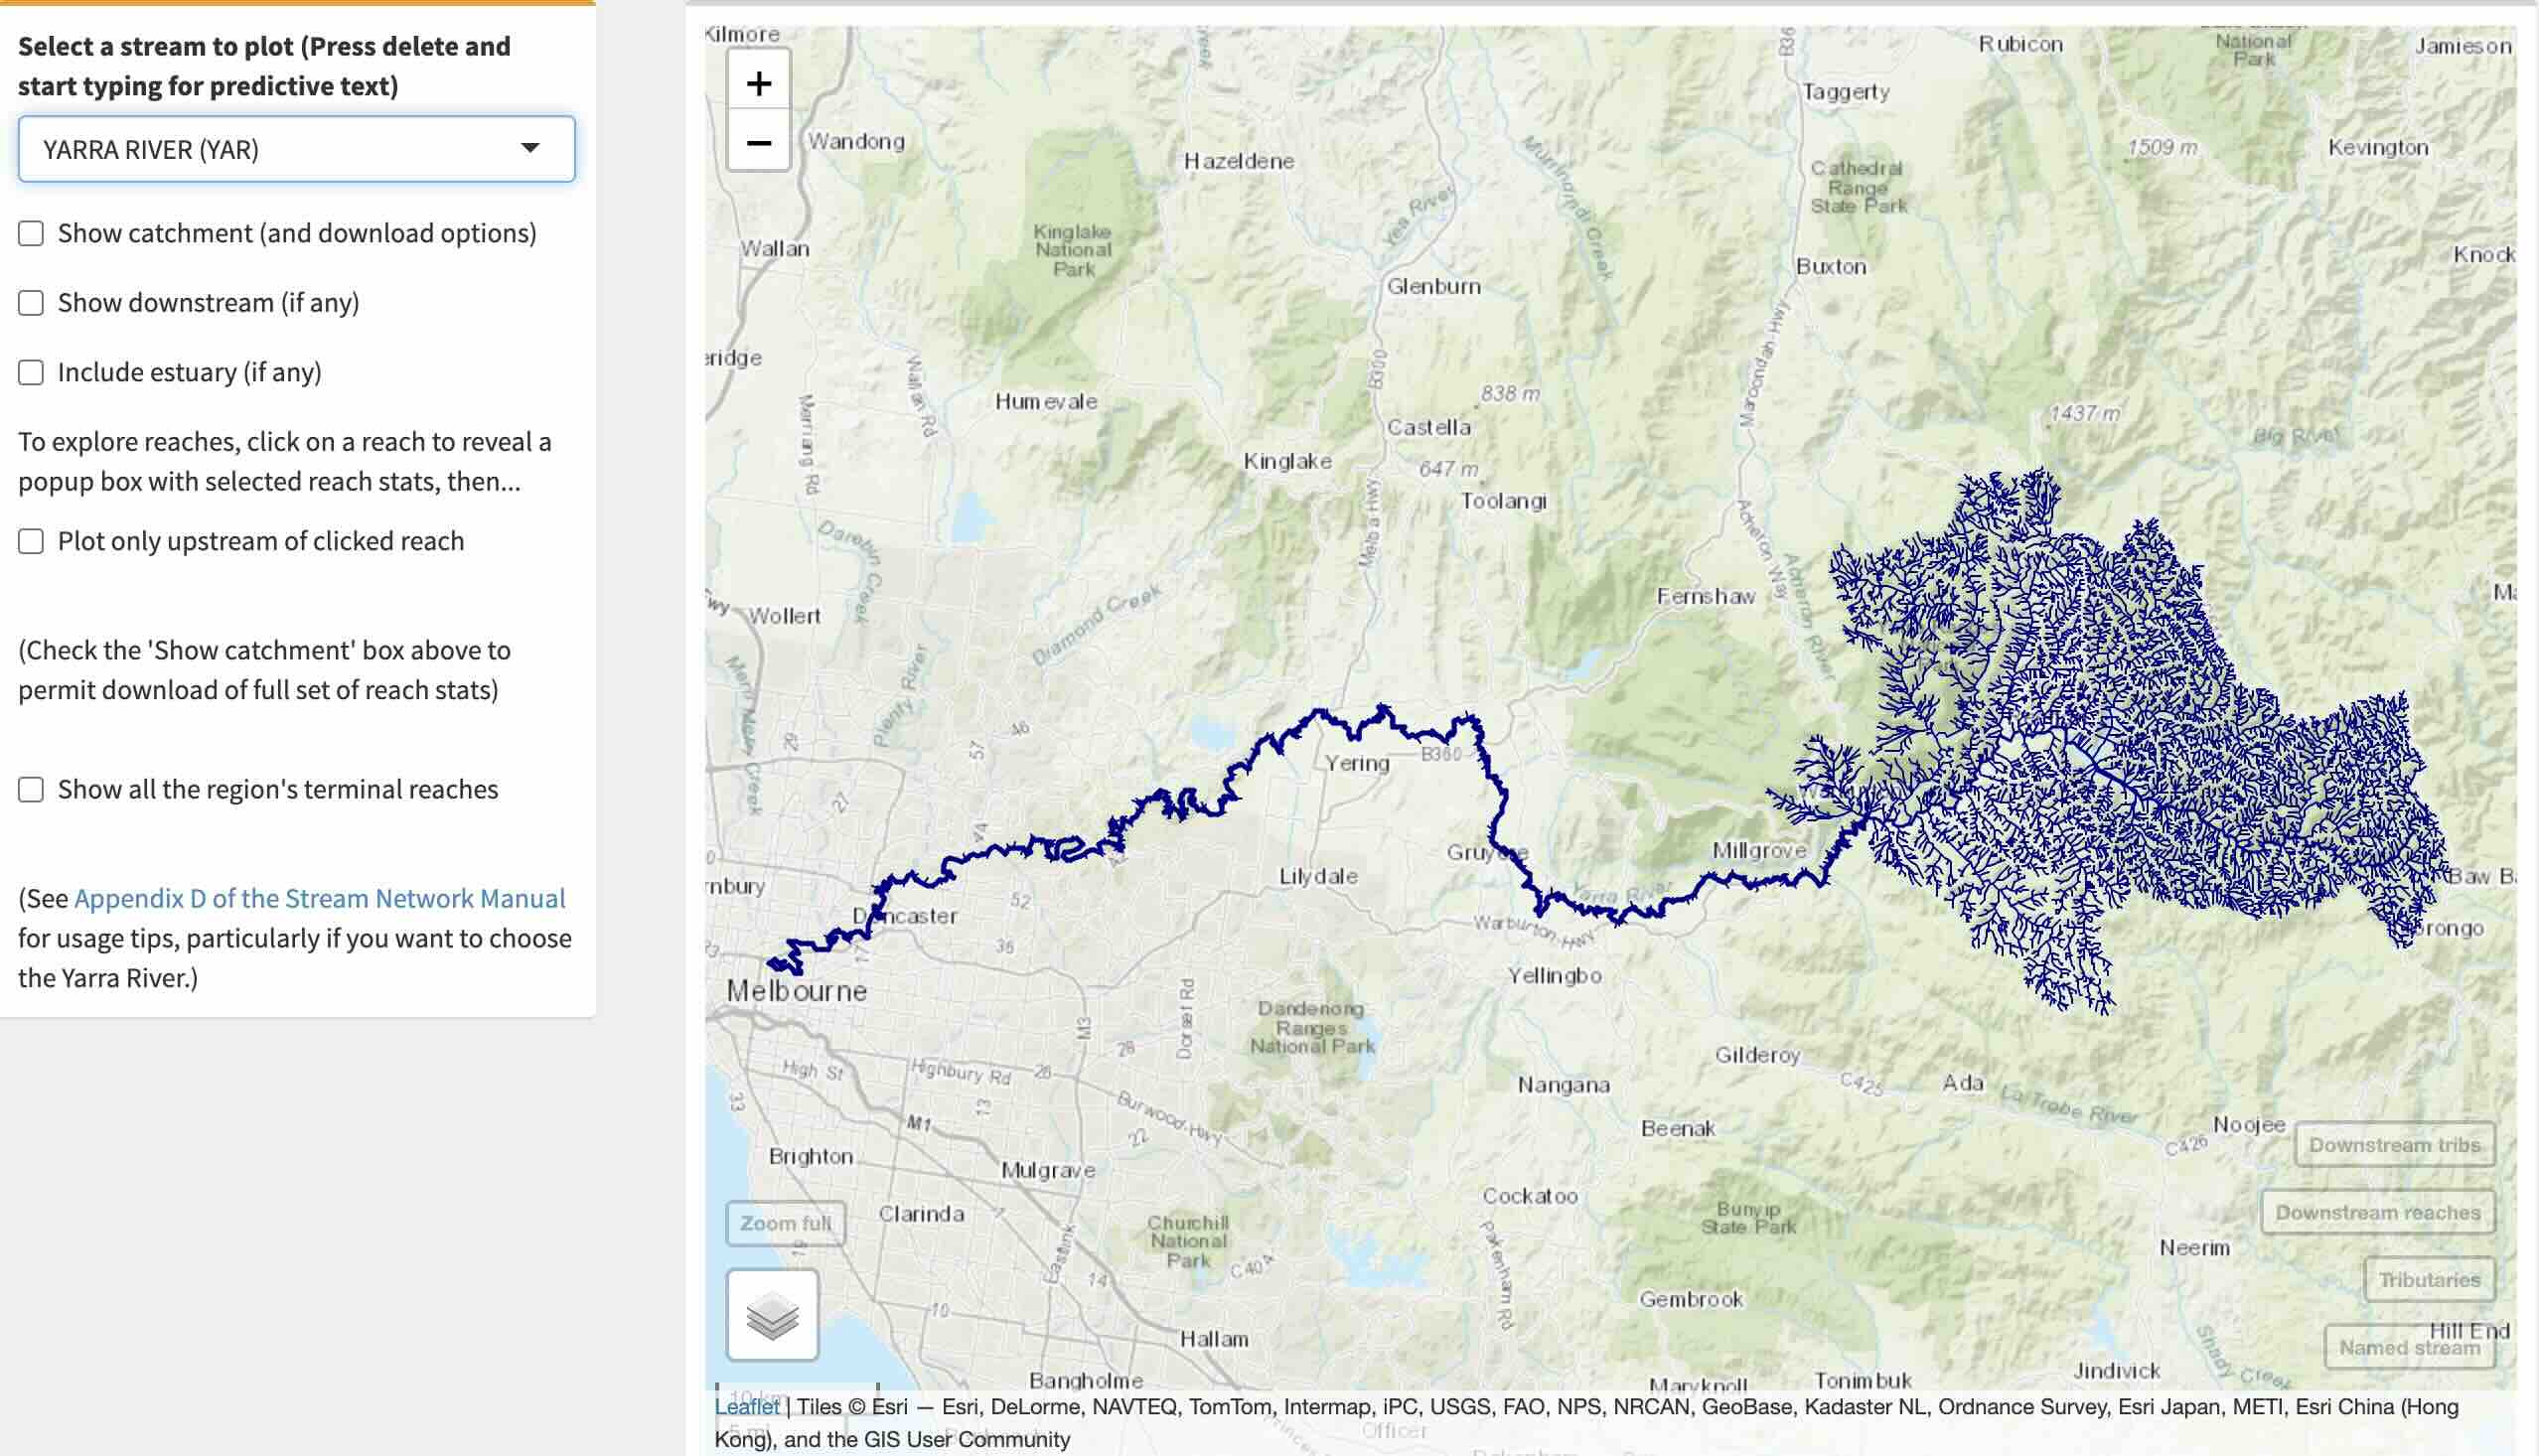
With that displayed, you can explore any of the downstream tributaries like we did with Damper Creek downstream of Branch Creek above. If you really want to push the app, and plot all of the streams of the Yarra catchment at once, select the most downstream reach (at Johnston St Collingwood if show estuary is not checked) and check the Plot only upstream of clicked reach
option. If it doesn’t crash the server, it will eventually plot a map like this. But you may want to go and have a cuppa while it’s doing it….
The drop-down list contains main streams and their major tributaries (4,505 in total), but not the full complement of 35,589 streams in the stream_names tables. The smaller tributaries that are not included in the list can be accessed by selecting their larger downstream streams, and exploring their tributaries on the map (as described in this appendix).↩︎
…if it’s not a very small tributary. See footnote 1.↩︎
But note the difficulty raised by the large size of the Yarra catchment, below.↩︎