Appendix E — Quality assessment of and corrections to forest cover estimates from Nearmap data
This appendix describes the process used to correct Nearmap tree-cover estimates for 2022 in version 1.3 of the network, which in part were inconsistent with their 2018 estimates. The underestimates were from several images, predominately in broad areas of forest, and could not solely be explained by topographic shading. The most common discrepancies between the two estimates were in forests with mosaics of forest types of different heights (e.g. Tall eucalypt forests grading to myrtle beech forests or tree-fern groves), where the lower forest was often misclassified in 2022 as low vegetation (<2 m). Low open woodlands with tree heights 2-4 m also tended to be estimated as being sparser in 2022, in areas with no change over the 4 years discernable from visual inspection of the nearmap image series.
Correcting these discrepancies is important because there are many areas in the region where there was real loss in tree cover between 2018 and 2022, either resulting from storm damage in 2019 or from forest clearing. The corrections I have made are not perfect, but do ensure no spurious declines in attenuated forest cover in ~300 sites that were monitored over this period (and thereby ensure more accurate estimates of tree cover for 2022 across the region).
The changes made also affect 2018 tree-cover estimates reported in chapter 7, as AF for areas covered by 2022 imagery that were not covered by 2018 imagery (mostly in the Yarra Ranges) had been estimated using the 2022 imagery. In those areas, the same corrections have been made to both years.
For long-term use of these data for assessment of forest cover change, more consistent estimates of forest cover will be required in future data deliveries (perhaps in combination with revision of the 2018 and 2022 data).
E.1 Unexplained differences between 2018 and 2022 tree cover estimates: Dandenong and Yarra Ranges on 5 Feb 2022
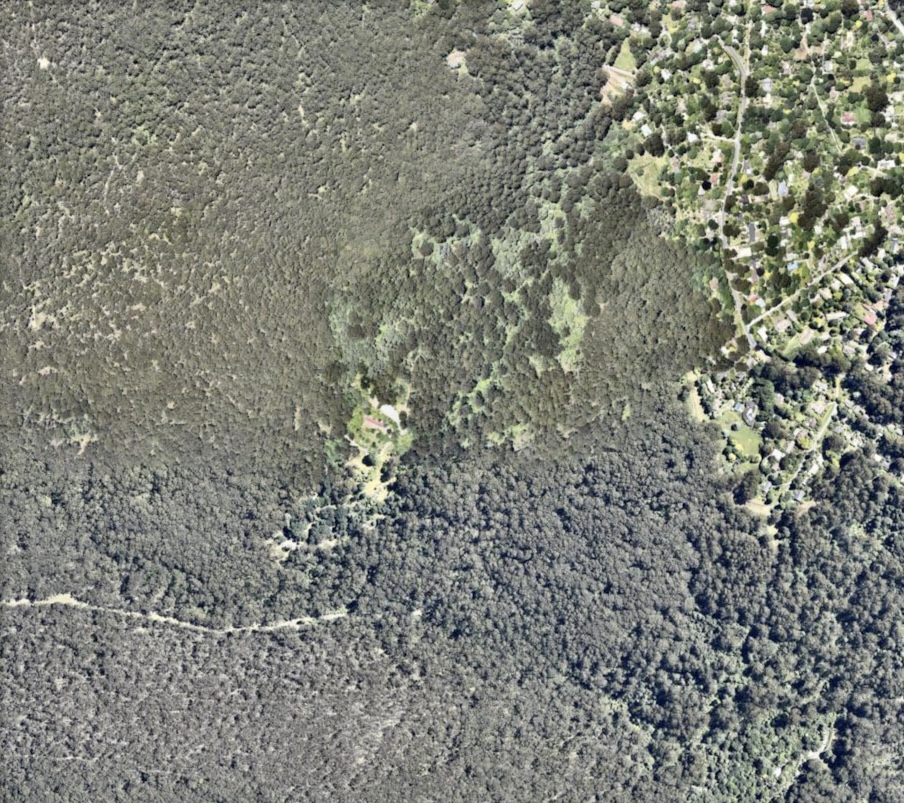
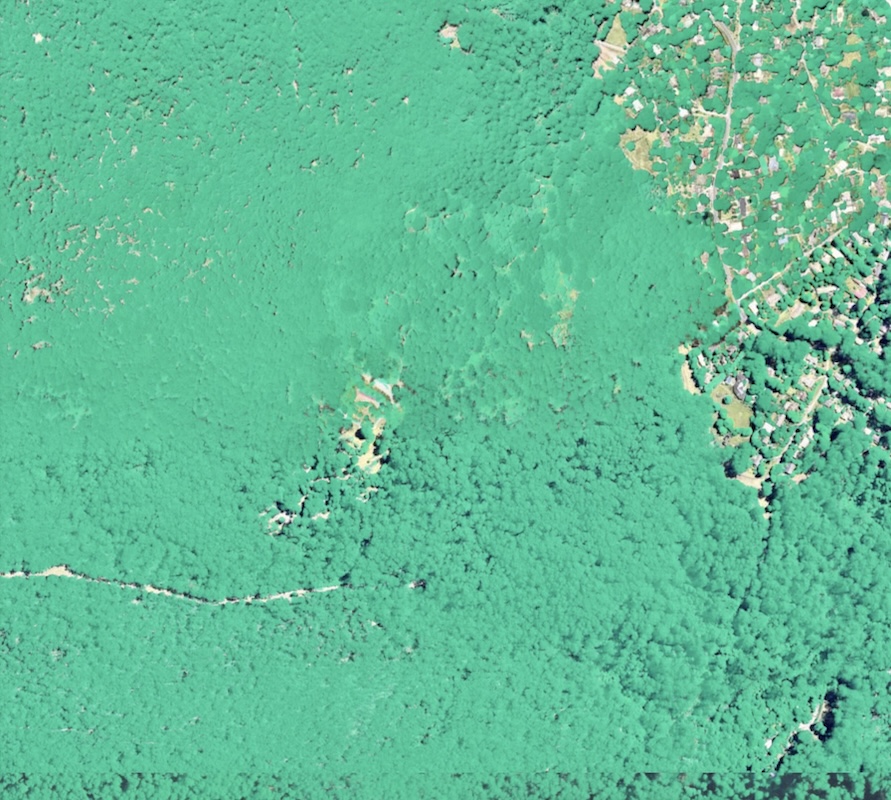
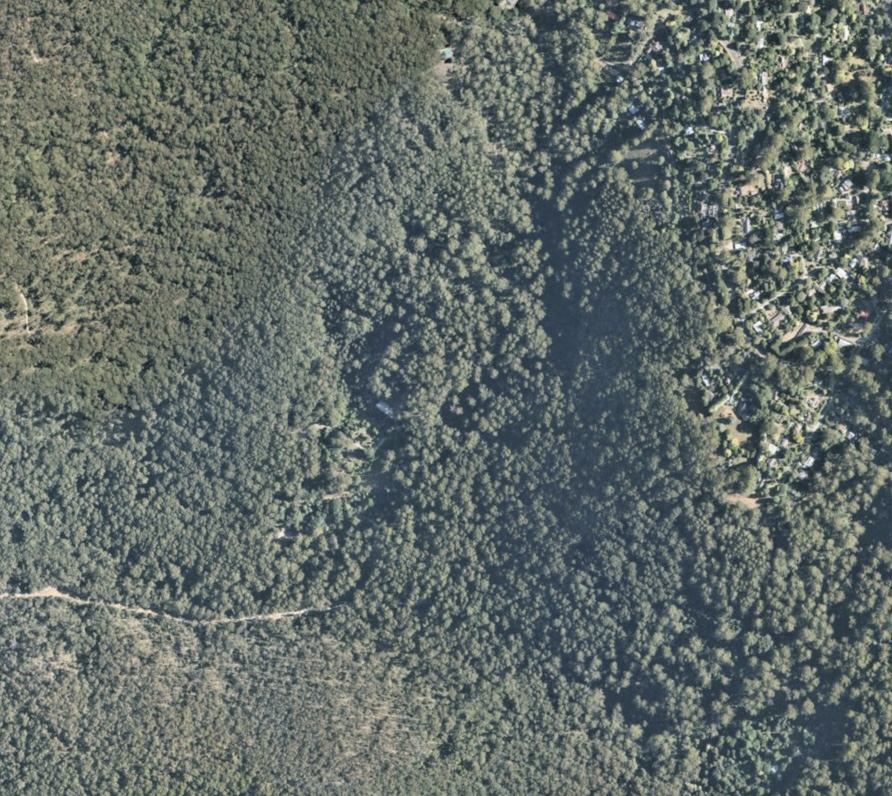
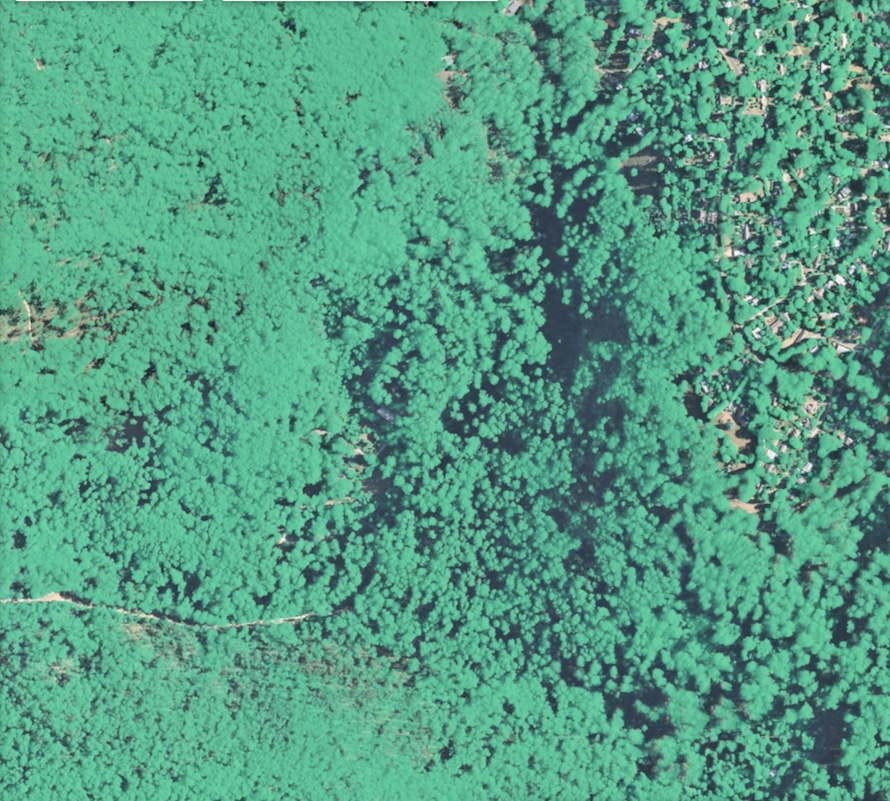
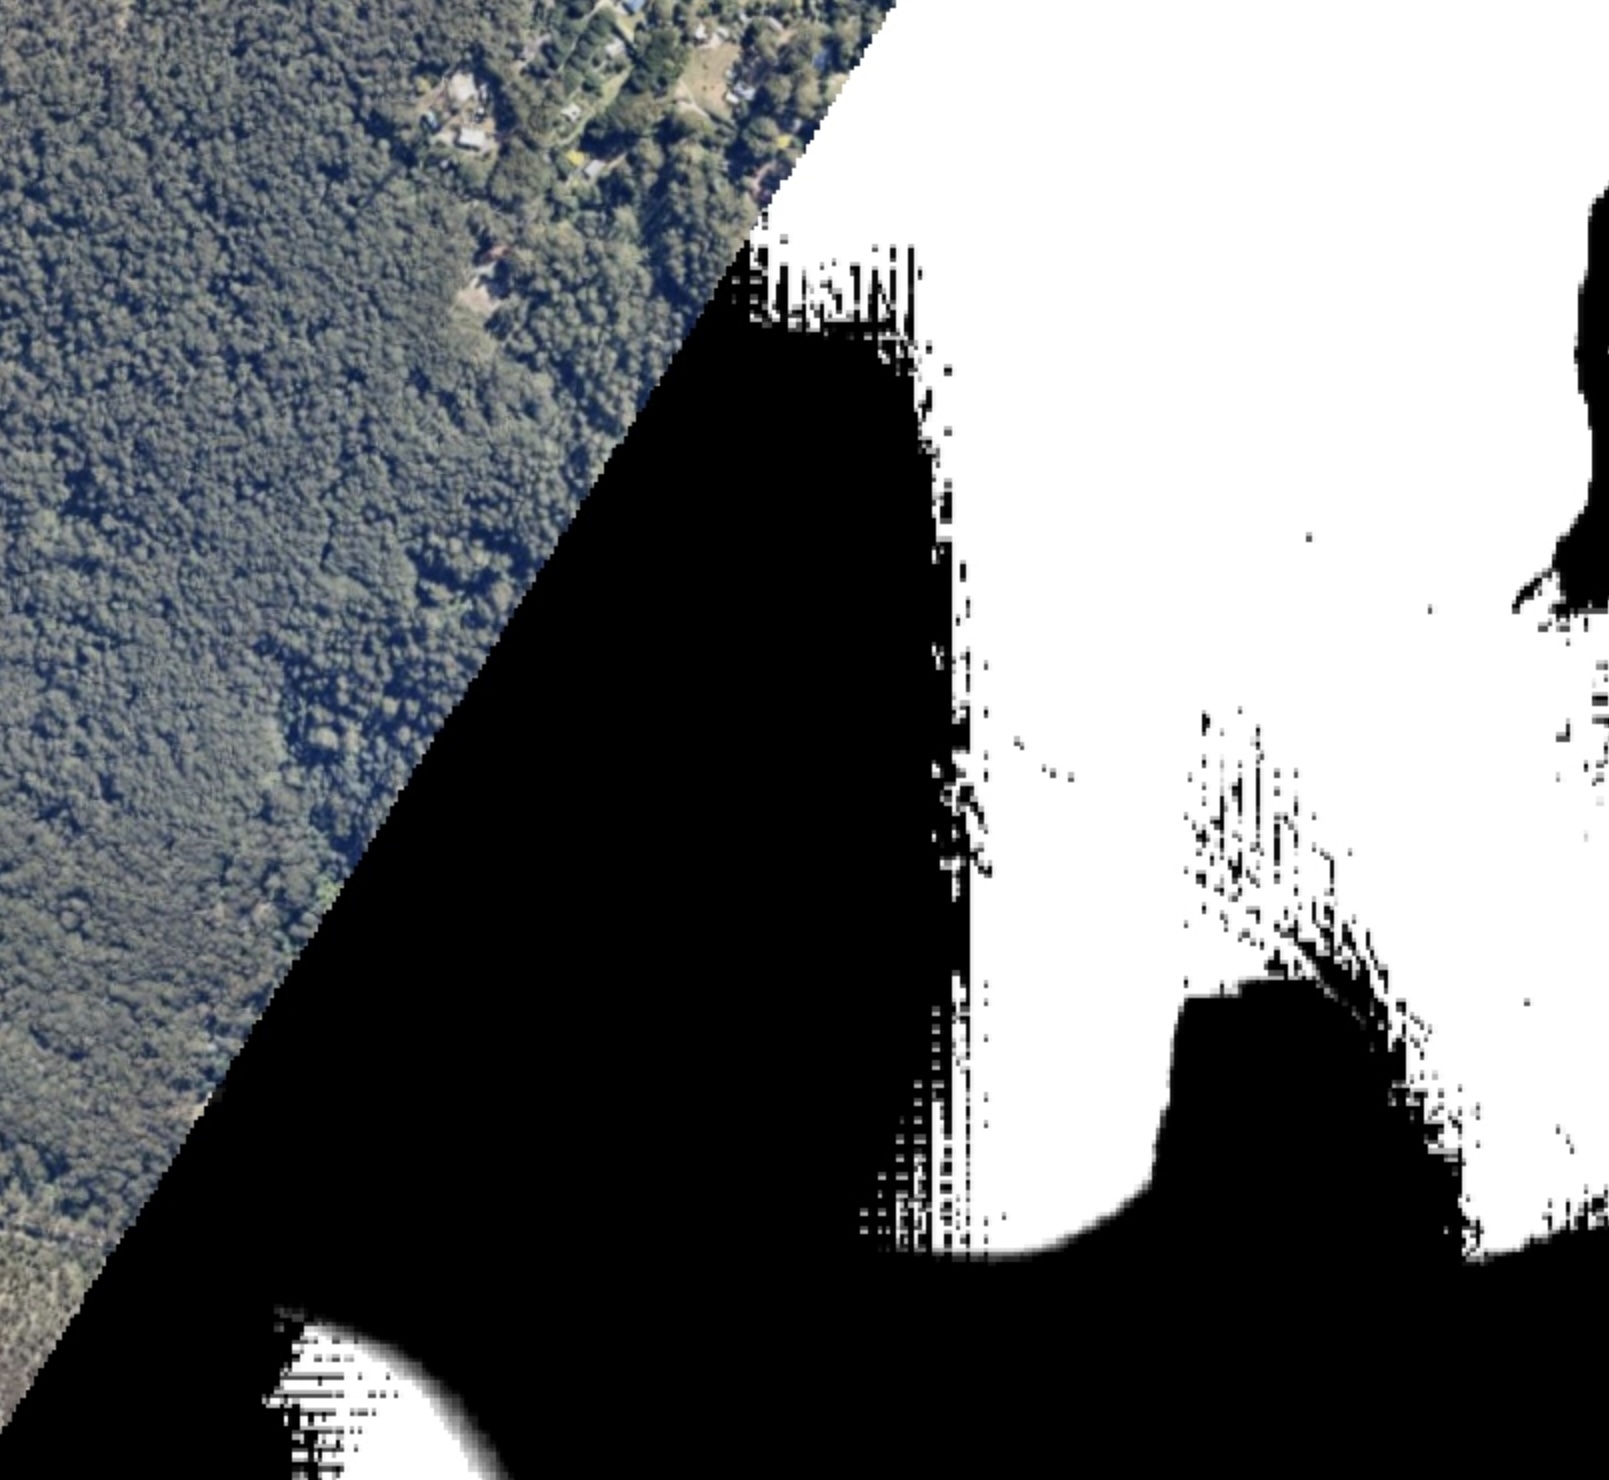
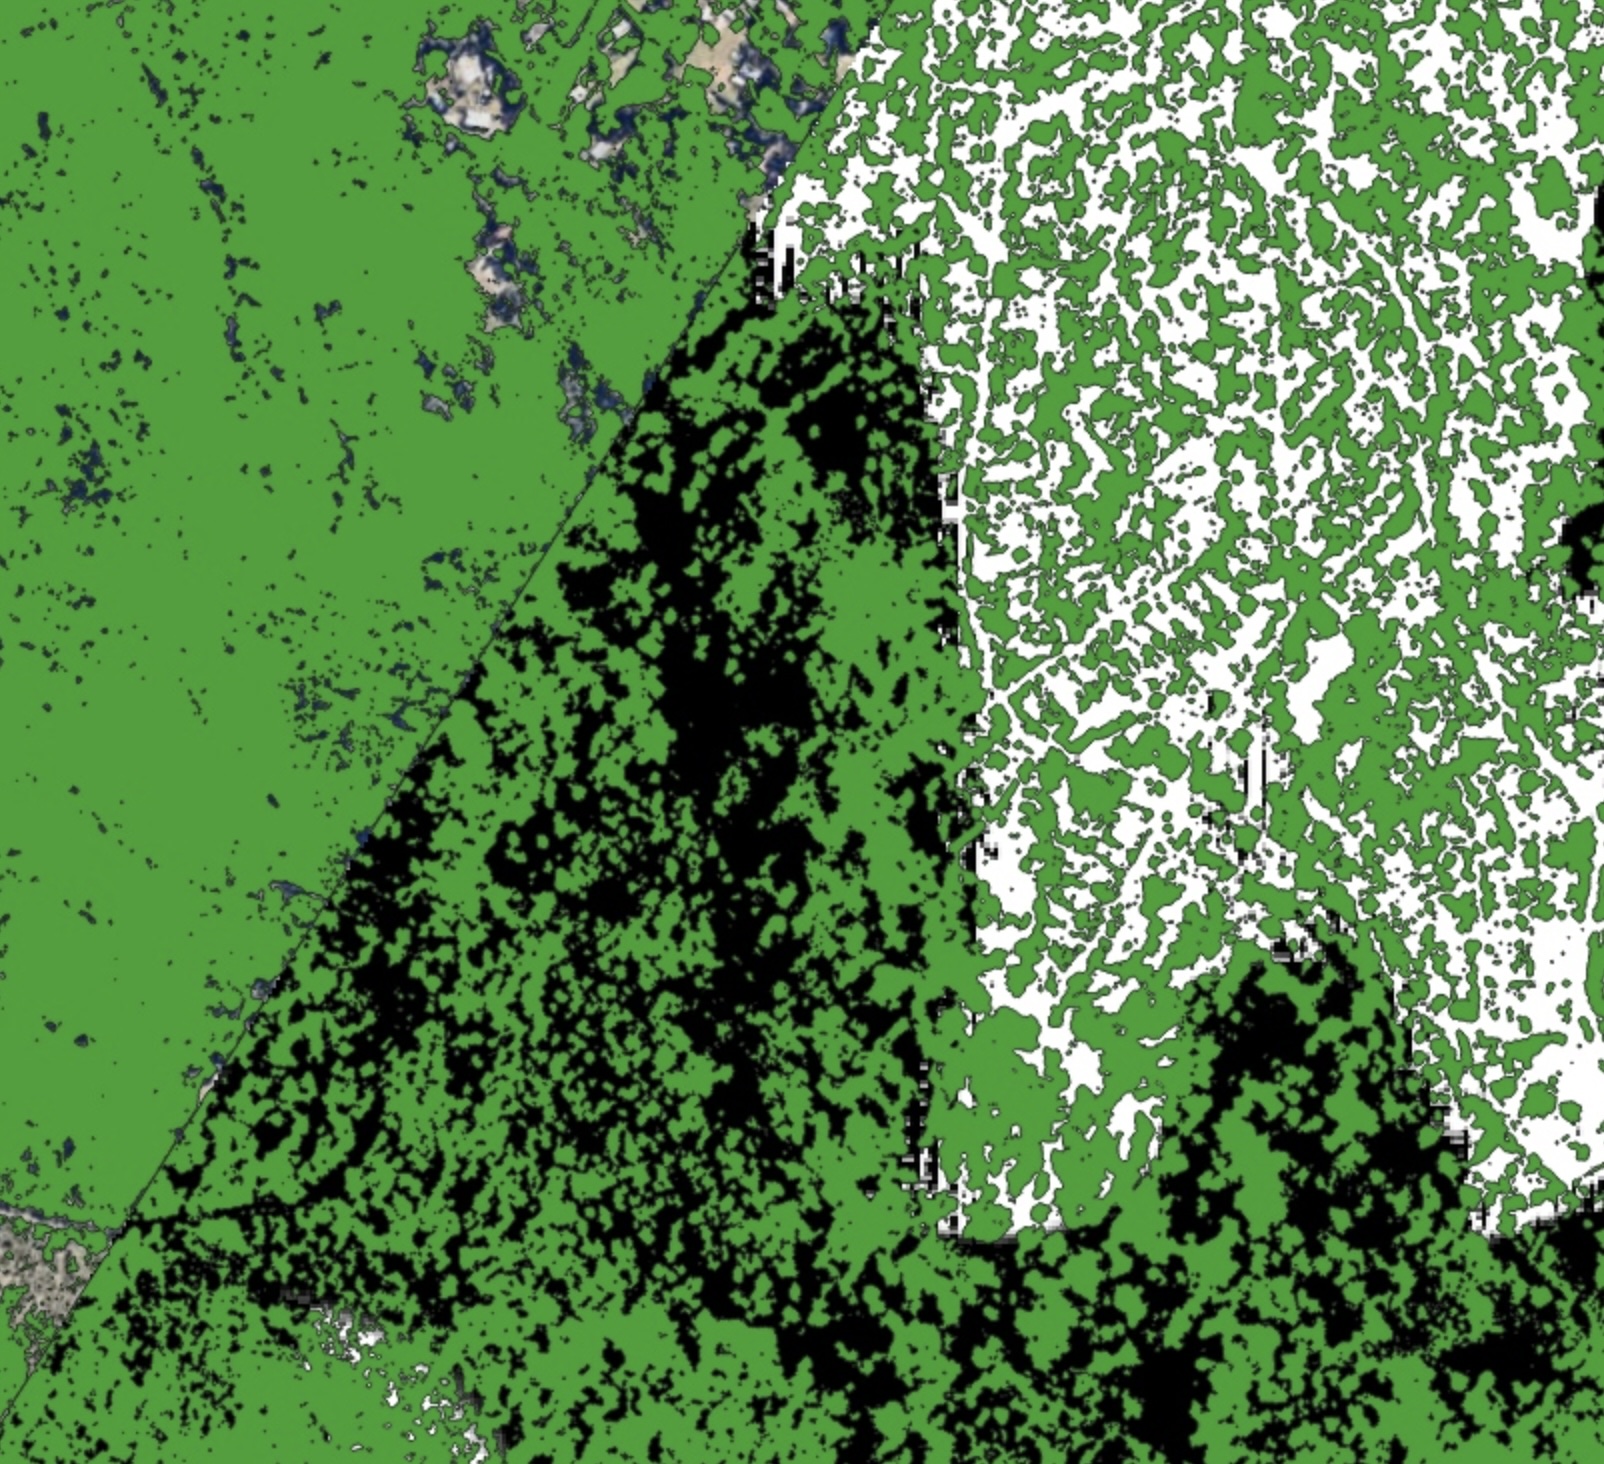
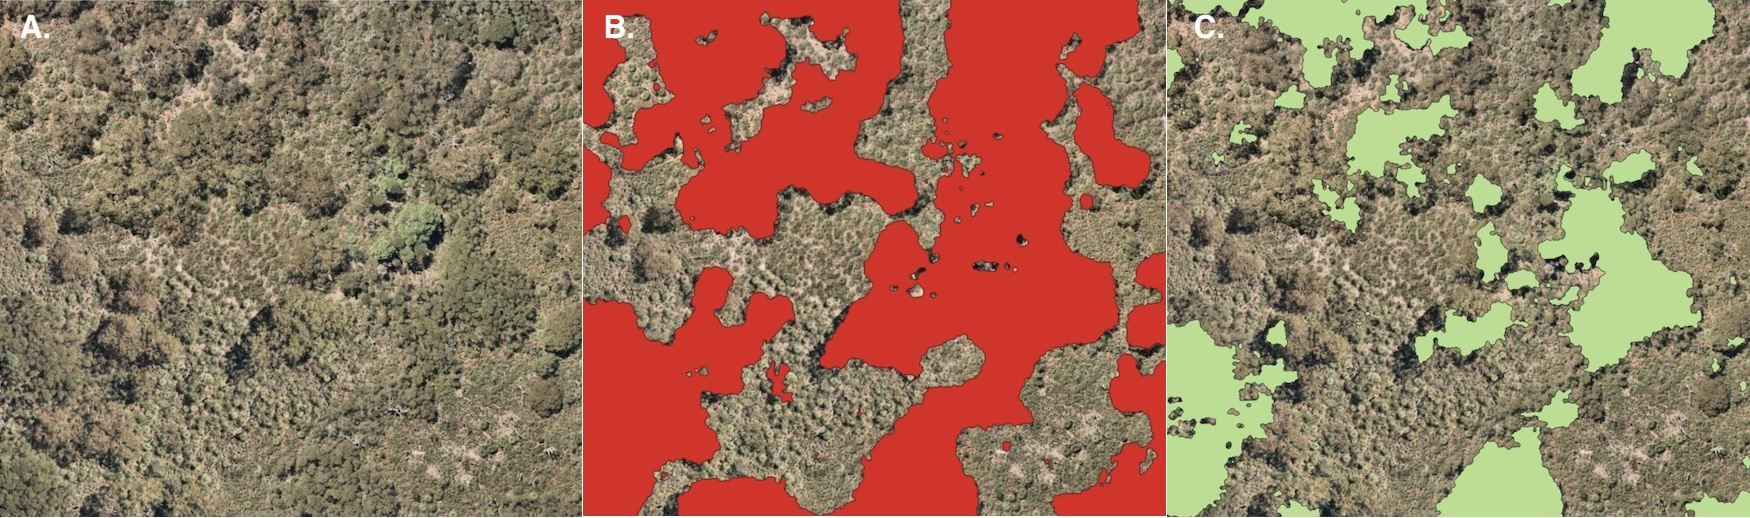
I first discovered errors in the 2022 imagery in an area of the Dandenong and Yarra Ranges covered by the image captured on 5 Feb 2022. The 2022 image was taken in the morning, and shows topographic shading not evident in the 2018 image (Figure E.1 A, C).
The resulting 2018 AI medium-high vegetation polygons, used to estimate tree cover, correctly classified almost all of the forest as covered by tree canopy (including the light areas in Figure E.1 A—which are groves of tree ferns, typically taller than the 2-m threshold for medium-high vegetation— Figure E.1 B). In contrast, the 2022 medium-high vegetation polygons left gaps in shaded areas (Figure E.1 D), where there had been no change in forest cover since 2018. These shade-induced underestimates are of particular concern for estimates of attenuated forest cover because they omit tree cover along streams, which carry the greatest weighting.
Nearmap advised that the errors were likely the cause of a greater degree of shading in the image captured on 5 Feb 2022 in this area. Therefore my first attempt at correcting these errors focused on modelling topographic shade in the area covered by this image (described below).
Compilation of Nearmap imagery is complex and an image attributed to a single date may be stitched together from multiple images taken over several hours or even days. A close inspection of the 2018 image (capture date 23 Dec 2018 Figure E.1 A) reveals two distinct images (note the difference in grain and colour above and below the horizontal line across the bottom third of the image). The photo angle and shadows cast by the trees are different above and below this line (evident when zooming in on the imagery), because they were captured hours apart.
During this process of error detection and correction, Nearmap made a method available for extracting the image timestamp for any point in the region (requiring permissions to access to their AI data). I used this method to extract the time stamp for a grid of points 1 km apart covering all imagery used to extract the vegetation polygons for 2018 and 2022. To automate this, I wrote the function point_nearmap_timestamp() in mwstr_network_functions.R which takes latitude, longitude, capture date, and an API key provided by Nearmap as inputs. Given the timestamp for each point in the grid, I then calculated the angle of the sun for the image at that point using the R function oce::sunAngle().
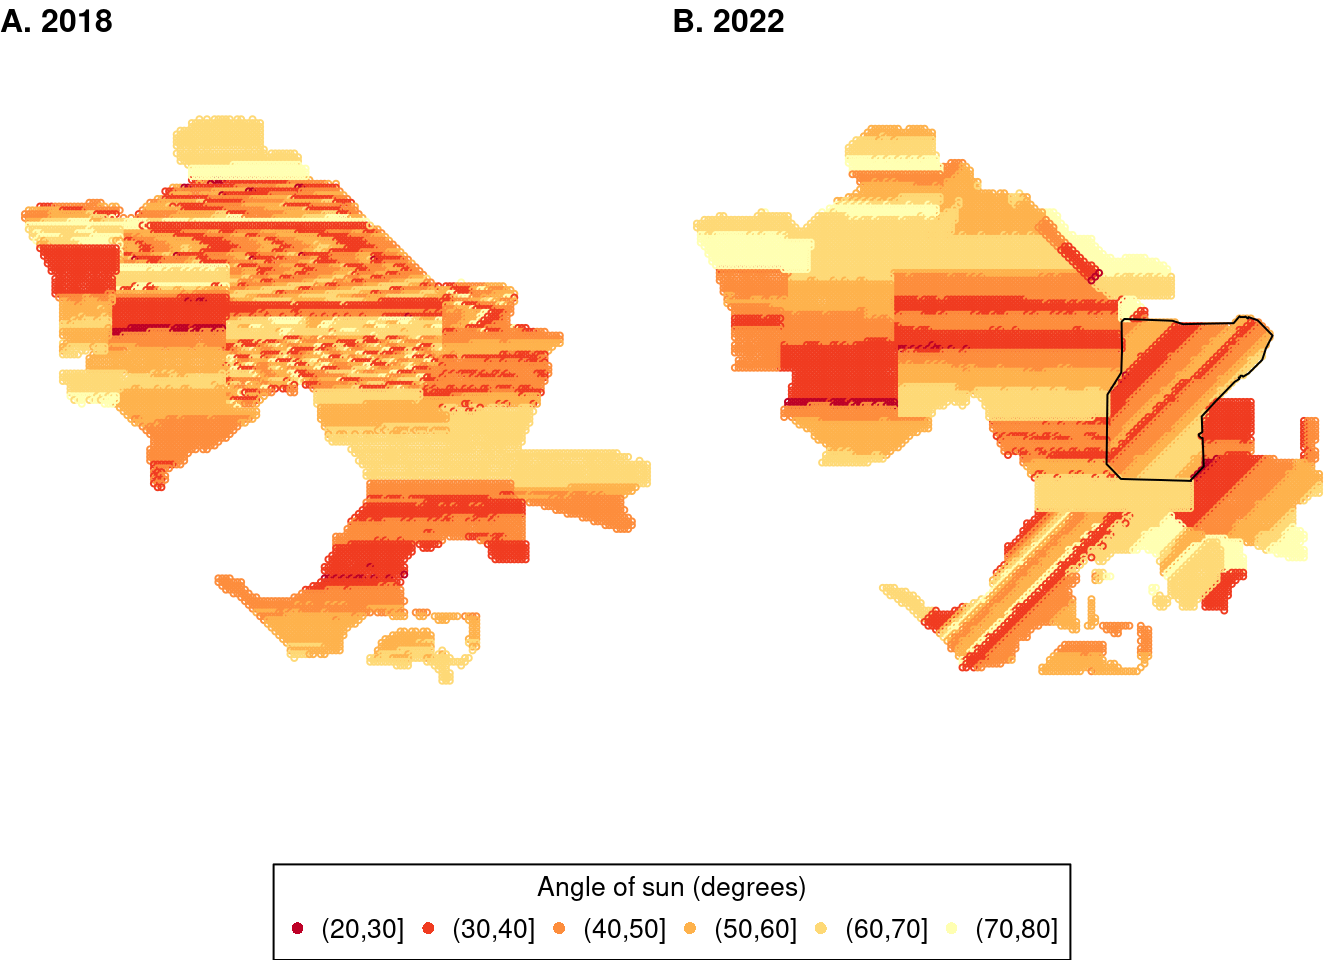
The resulting maps (Figure E.2) show that each image is composed of many photos taken on repeated flight paths. Both 2018 and 2022 imagery included images with the sun at less than 40 degrees, including the 5 Feb 2022 image (outlined in Figure E.2 B). However, that image did not have areas of unusually acute sun angle, as had been originally postulated.
Nevertheless, a raster of modelled topographic shade across the 5 Feb 2022 image achieved the aim of identifying most areas in the image with no real change in tree cover, but had lower tree-cover estimates in 2022 than 2018, while omitting those areas in which tree cover was lost in the intervening years1.
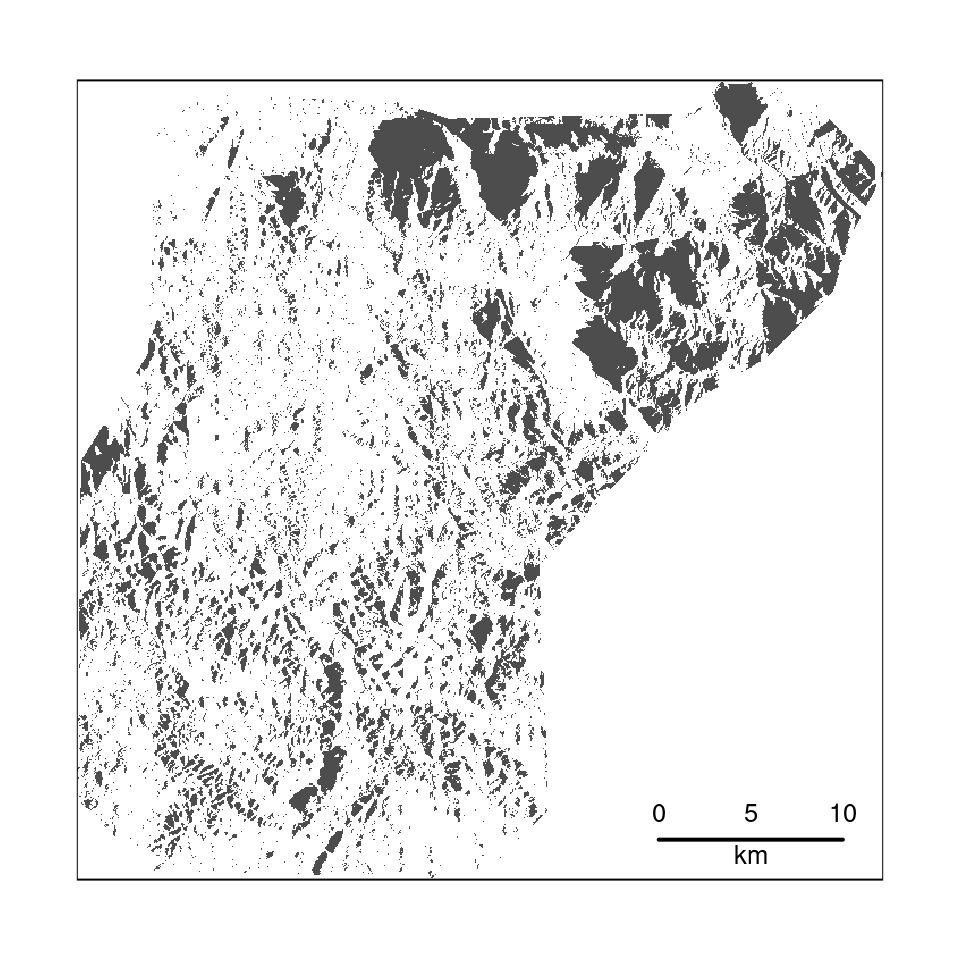
I used the rayshader R package (Morgan-Wall 2024) to model topographic shading from the 5-m digital elevation model used for raster calculations in the mwstr stream network Section 3.3. The shade model for the image timestamp did not accurately represent observable shade in the image because the tall forest trees create shade not modelled by the digital elevation model. However, the area of underestimated tree-cover was well modelled by topographic shade at 0725 h (Figure E.3), ~2 hours earlier than the earliest timestamp in the image.
25% of the area covered by the 5 February 2022 image was shaded at 0725 (Figure E.4) on 6 February. I inspected all areas classed as shade and concluded that there was little or no area of altered tree cover between 20182 and 2022 in these shaded areas. Importantly, there were areas of lost tree-cover after storms in 2018 within unshaded areas in the 5 February 2022 image, which were accurately identified as having reduced tree cover by the Nearmap 2022 medium-high vegetation data.
Therefore to correct areas of underestimated 2022 tree cover, while retaining correctly estimated areas in the 2022 image, I converted tree-cover values of all gridcells classed as shaded by the shade model with 2018 values where available, and 2006 values where not.
E.2 Inconsistencies in other images
Following corrections to the 2018 and 2022 tree cover rasters using the shade model (code below), I calculated AF values for all sites in the Melbourne Water Macroinvertebrate Database and identified all sites for which AF in 2022 was substantially lower than in 2018. For each of these sites, I checked consistency between the 2018 and 2022 Nearmap medium-high vegetation polygons in subcatchments upstream, and consistency in visible cover between the 2018 and 2022 Nearmap images that were used to produce the polygons. Where an image was unclear (e.g. because of shading), I also checked images taken in surrounding months. If the 2022 polygons correctly represented loss of forest in the intervening years, the data was accepted as correct for that site. If there was no discernible change in forest cover in the intervening years, I drew a polygon around the underestimated area and saved it to the spatial table corrections_2022.gpkg.
Underestimation of tree-cover by the 2022 polygons was common in broad areas of forest, and in many cases shading could not explain the 2022 underestimations. Some examples follow.
Several unshaded areas in the 5 Feb 2022 image area were identified and included in the corrections table: Olinda and Lyrebird Creek catchments upstream of their confluence, the upper Sassafras Creek, and the Yellingbo Forest on Woori Yallock Creek.
Estimates of tree cover in the low open woodlands of the Werribee Gorge State Park and the Mornington Peninsula National Park were inconsistent between 2018 and 2022, despite no significant change in forest cover over the four intervening years. Part of these inconsistencies can be explained by topographic shading in the Werribee Gorge area. However, in both areas, the 2022 imagery estimated lower tree cover even in areas that were unshaded in both images (Figure E.5).
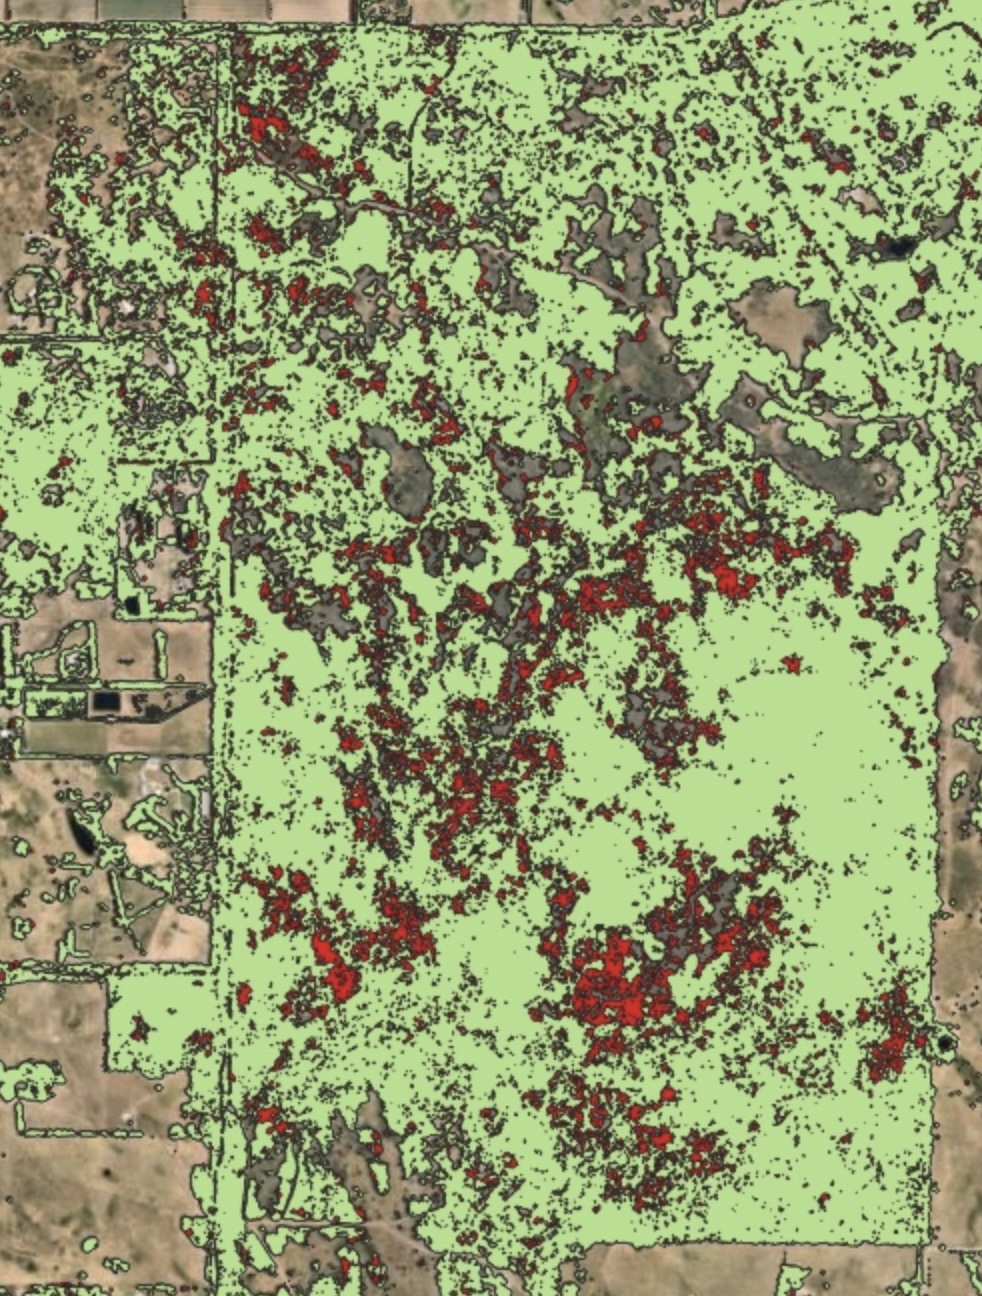
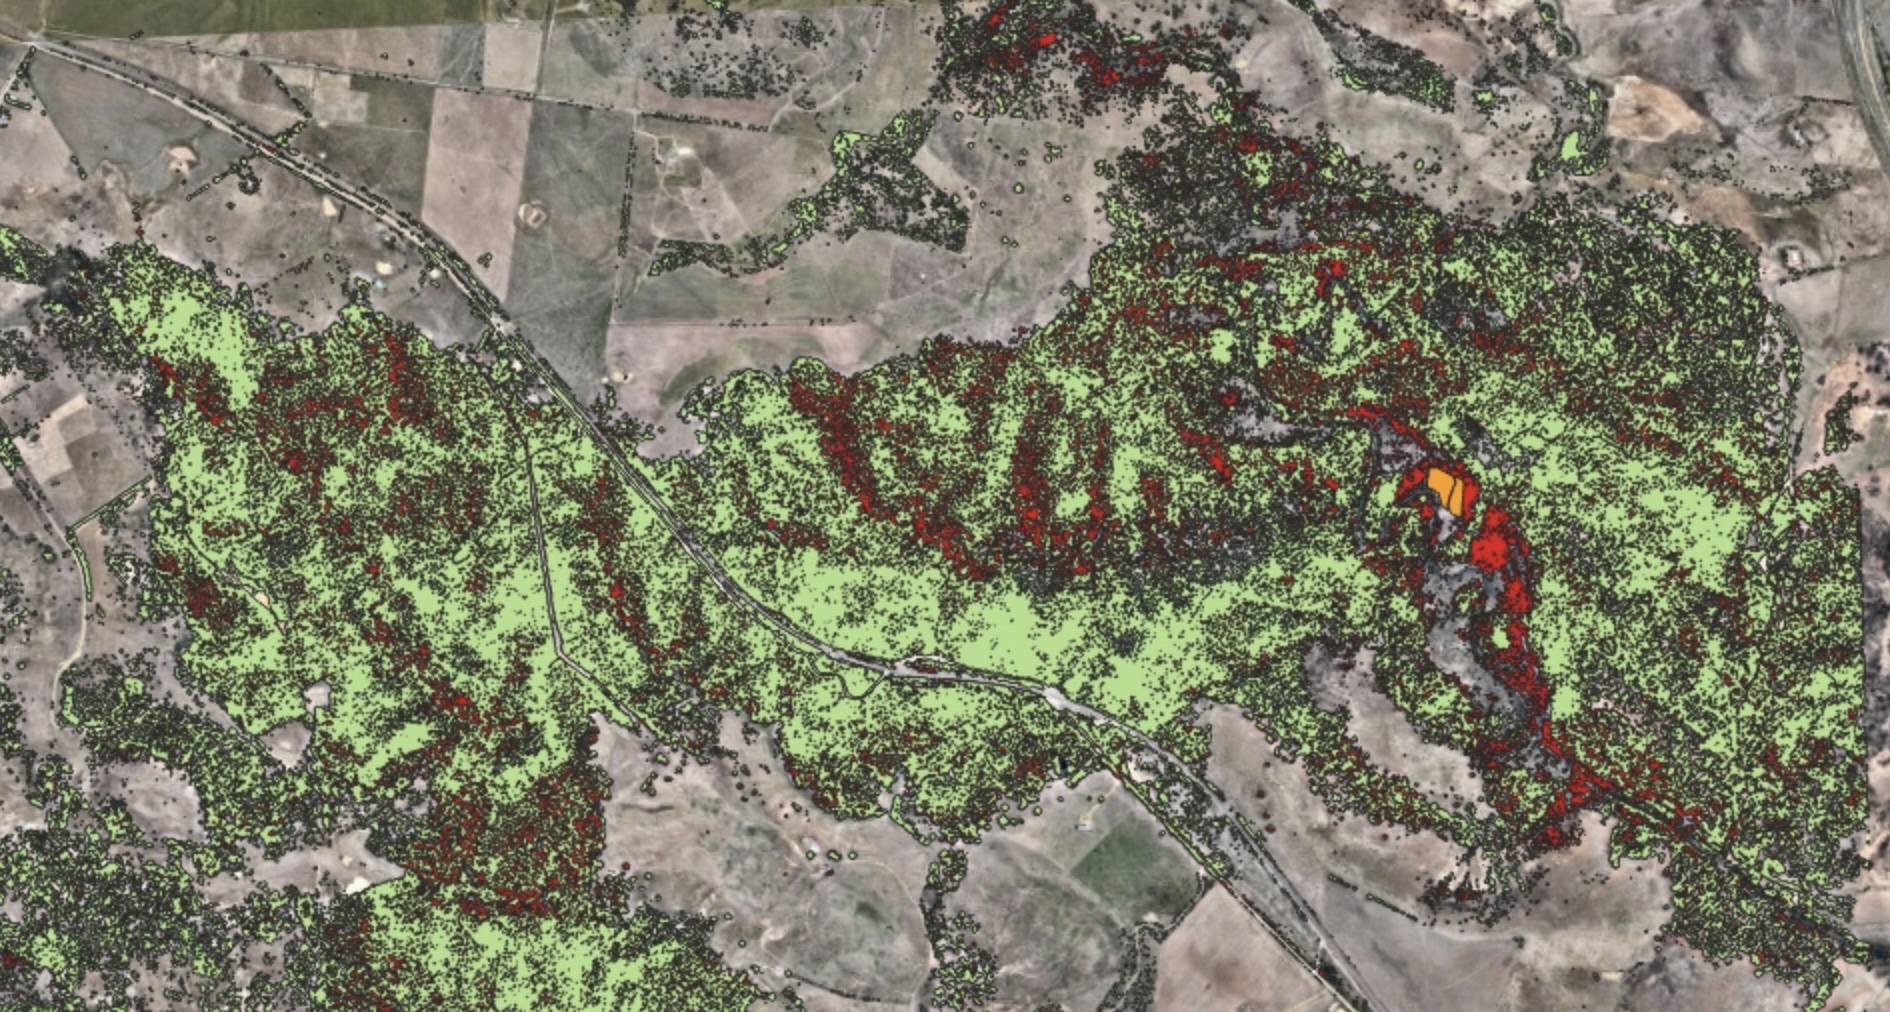
Close inspection of the differences suggest that in places, the 2018 estimates are slight overestimates (while the 2022 estimates are larger underestimates, missing large areas of tree cover: Figure E.6). It is possible that these inconsistencies are a result of many of the trees being close to the 2-m threshold for medium-high vegetation classification. Therefore such areas require quality assessment with each delivery of new data (this will include the low forests of French Island that had not yet been captured by 2022).
To ensure consistency in estimates of forest cover between 2018 and 2022, I elected to use the 2018 estimates (which appear to be more accurate) for both years. This decision may have implications for comparisons with delivery of future data: consistency of tree-cover estimates in unchanged areas will remain a priority.
Most areas requiring correction were limited to five of the 25 images used in 2022 (Figure E.7):
the image discussed above centering on the Dandenong and Yarra Ranges captured 5 Feb 2022 (Figure E.4);
the narrow band in the north-west captured on 8 Feb 2022;
the forested sections of the central western image captured on 25 March 2022;
the Mornington Peninsula image captured 19 Jan 2022;
The image to the east of the 5 Feb 2022 image, in the Yarra and Bunyip Ranges 27 Nov 2022;

However, the small number of images with underestimations could be as much a product of other images covering few forested areas as inconsistencies being restricted to these images. Tree-cover in small forested areas in other images were also underestimated (south of the Bunyip Ranges, captured 15 Jan 2022; Andersons Creek Reserve on the southern edge of the central image taken 19 Feb 2022). This, together with the similar distribution of sun angle betwen 2018 and 2022 images (Figure E.2) suggests an systematic difference between estimates from the two years across the region.
The lack of published methodological detail for these data makes it impossible to diagnose the cause of these differences. I have made the corrections described herein to permit use of the data for modelling responses to forest change between 2018 and 2022. For long-term use of these data for similar purposes, more consistent estimates of forest cover will be required for future data delivery (perhaps in combination with revised estimates for 2018 and 2022).
Code used to correct 2022 and 2018 tree-cover rasters can be found at the end of the source qmd version of this document. The original version of r_tree_series.tif was saved to the archive, https://tools.thewerg.unimelb.edu.au/mwstr/archive.html as mwstr_v1.3.0_r_tree_series.tif, and the revised version saved over r_tree_series.tif. Polygon files used to make the corrections were also saved to the archive as tree_2022_correction_files.zip.
Note that Figure E.1 C and D are on the edge of the 5 Feb 2022 image, and the area in the top left of the figure with a different grain and colour from the rest of the figure is from the 28 Dec 2021 image.↩︎
or 2006 in the portion of the area without 2018 tree-cover estimates↩︎